Advertising metrics, bidding, budgets, media planning and ad operations

Cost per View Advertising: Calculate Cost, Quality and Break-Even Value

Use this practical cost per view advertising guide to define how video-view costs are defined, bid, measured and reconciled to qualified attention and business outcomes, select channels and controls, establish a measurement contract, calculate break-even economics and scale only verified outcomes.

cost per view advertising
Cost per View Advertising operating model for intent, creative, budget, measurement and economics

What cost per view advertising means in practice

Cost per View Advertising is the operating discipline used to how video-view costs are defined, bid, measured and reconciled to qualified attention and business outcomes. For video advertisers, media buyers and campaign analysts, the useful definition begins with the decision being made, the paid event being purchased and the business outcome that must be verified. A campaign is not successful merely because a platform reports delivery. The operating model needs an objective, an audience or query hypothesis, an offer, a controlled budget, a landing experience and a reconciled outcome record.

Cost per view is a billing and optimization metric for eligible video interactions. It is not proof that the viewer understood the message, visited the site or created incremental value. This boundary matters because teams often use one label for several different jobs. Separate demand creation from demand capture, channel execution from analytics, and platform conversions from accepted business outcomes. The separation creates clear accountability and prevents a dashboard from becoming the only source of truth.

Use it when the platform view definition, target CPV, view quality, follow-on actions and attribution window are documented before launch. The first implementation should be narrow enough to diagnose. One objective, one market, one primary conversion definition and one capped budget make learning possible. Combining unrelated offers, geographies and funnel stages may create more volume, but it weakens the evidence needed to understand why the campaign worked or failed.

Objective, audience and commercial boundary

Start cost per view advertising with a written objective that names the business change, not only the media action. “Generate qualified sales conversations below the approved acquisition threshold” is stronger than “get more clicks.” Define who qualifies, what evidence marks acceptance, when value is recognized and which exclusions prevent irrelevant demand from entering the test.

The audience model for cost per view advertising should distinguish observed intent, contextual relevance, declared attributes, modeled signals and retargeting eligibility. Each signal has different reliability, privacy implications and scale. Record why the signal is useful, how it can be excluded and what happens when the platform cannot provide source-level evidence.

For Cost per View Advertising: Calculate Cost, Quality and Break-Even Value, create an economic boundary before launch. Document gross margin or expected value, acceptable acquisition cost, refund or rejection risk, operational capacity and the maximum loss allowed for learning. This boundary converts budget from a vague spending limit into a controlled investment with explicit stop and expansion rules.

Channel and campaign architecture

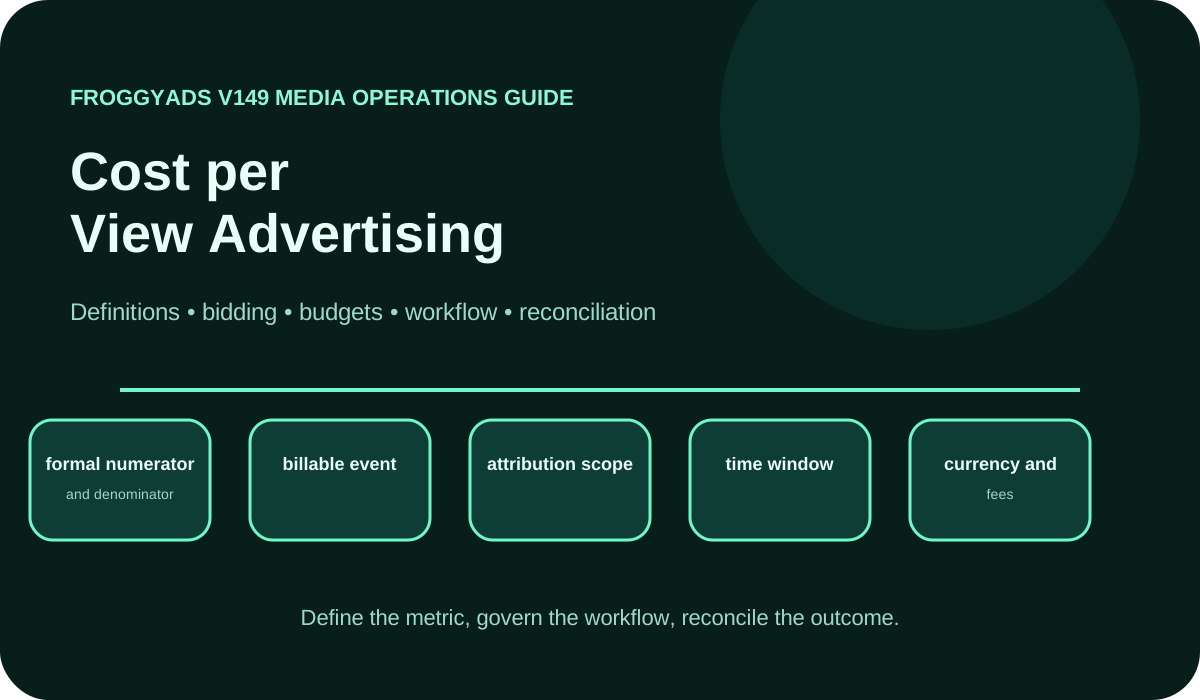
The operating architecture for cost per view advertising includes formal numerator and denominator, billable event, attribution scope, time window, currency and fees, quality adjustment, business-value link, and decision threshold. Treat each item as an accountable object with an owner, an input, an output and a validation rule. The campaign structure should expose meaningful differences in intent, creative, inventory and economics rather than hiding them inside one aggregated total.

For Cost per View Advertising: Calculate Cost, Quality and Break-Even Value, use naming conventions that preserve objective, market, audience or query theme, format, offer, landing page and test version. Stable names and identifiers make it possible to join platform delivery to analytics and business records. They also protect the team when a campaign is copied, migrated or audited months later.

Separate exploration from exploitation in cost per view advertising. Exploration tests new audiences, queries, placements, messages or bidding approaches with capped budgets. Exploitation allocates more spend to verified combinations while maintaining holdouts and monitoring marginal performance. Mixing both modes makes it difficult to know whether a budget increase reflects evidence or optimism.

Cost per View Advertising operating scorecard

Credit each stage only after a representative campaign proves the workflow and preserves enough evidence for review.

Decision layerOperating requirementEvidence required
formal numerator and denominatorDefine the owner, decision, data input and control required for formal numerator and denominator.Verify the output, exception path, export and rollback before the stage receives production credit.
billable eventDefine the owner, decision, data input and control required for billable event.Verify the output, exception path, export and rollback before the stage receives production credit.
attribution scopeDefine the owner, decision, data input and control required for attribution scope.Verify the output, exception path, export and rollback before the stage receives production credit.
time windowDefine the owner, decision, data input and control required for time window.Verify the output, exception path, export and rollback before the stage receives production credit.
currency and feesDefine the owner, decision, data input and control required for currency and fees.Verify the output, exception path, export and rollback before the stage receives production credit.
quality adjustmentDefine the owner, decision, data input and control required for quality adjustment.Verify the output, exception path, export and rollback before the stage receives production credit.
business-value linkDefine the owner, decision, data input and control required for business-value link.Verify the output, exception path, export and rollback before the stage receives production credit.
decision thresholdDefine the owner, decision, data input and control required for decision threshold.Verify the output, exception path, export and rollback before the stage receives production credit.

Offer, message and landing continuity

The message used in cost per view advertising should connect the user signal to a specific promise and next step. Avoid generic claims that could fit any audience. The ad should identify the problem, expected outcome, differentiator and required action while remaining accurate, policy-compliant and understandable without relying on visual tricks.

For Cost per View Advertising: Calculate Cost, Quality and Break-Even Value, landing continuity means the destination preserves the same promise, terminology and level of specificity as the ad. A strong click can still become a poor session when the landing page changes the offer, hides important conditions, loads slowly or asks for more commitment than the message prepared the user to make.

Create a pre-launch quality checklist for cost per view advertising: destination works on target devices, consent and tracking states are documented, the primary action is visible, forms validate correctly, important terms are disclosed and the page can be measured without depending on one vendor script. Creative approval should include the landing experience, not only the ad file.

Budget, bidding and pacing

Budget for cost per view advertising should be set from the approved learning loss and required sample, then constrained by daily, campaign and source-level controls. A budget is not proof that the market can absorb spend profitably. It is the maximum exposure allowed while the team tests a defined hypothesis.

For Cost per View Advertising: Calculate Cost, Quality and Break-Even Value, choose a bidding method that matches the maturity of measurement. Click-based bidding can be useful when conversion data is sparse, while conversion or value-based automation requires stable events and sufficient signal. Automation should not be asked to optimize an event that the business later rejects or cannot reconcile.

For Cost per View Advertising: Calculate Cost, Quality and Break-Even Value, review pacing at the level where decisions are made. A campaign can hit its daily budget while concentrating spend in one hour, placement, query class or audience segment. Track planned versus delivered spend, marginal cost, outcome maturity and remaining inventory opportunity before increasing limits.

Measurement contract and reconciliation

The core measurement set for cost per view advertising includes raw metric value, quality-adjusted value, accepted outcome rate, break-even value, variance by source, cohort stability, marginal change, and reconciled business value. Define the formula, data owner, time zone, currency, attribution window, inclusion rules and reversal handling for every metric. A shared label is not enough when platforms and business systems calculate it differently.

For Cost per View Advertising: Calculate Cost, Quality and Break-Even Value, use three reporting layers. The delivery layer records impressions, clicks, spend and platform events. The analytics layer records sessions and attributed behavior. The business layer records valid leads, accepted acquisitions, revenue, refunds, margin and capacity effects. Reconcile the layers instead of forcing one system to answer every question.

Measure cohorts and marginal changes in cost per view advertising. Cumulative averages can hide a recent decline, and platform attribution can overstate outcomes that would have happened anyway. Compare new spend bands, recent cohorts, source-level quality and delayed reversals before declaring the latest optimization successful.

Break-even calculation

Media cost + platform or service fees + creative and measurement cost + attributable operating effort, divided by the accepted outcome count. Compare that result with gross profit or approved lifetime-value contribution, not only platform conversions.

For Cost per View Advertising: Calculate Cost, Quality and Break-Even Value, use the same calculation for the baseline and the test. Record currency, tax treatment, attribution scope, refunds, rejected leads and the date when outcomes are considered mature.

Testing and optimization workflow

Write each cost per view advertising test as a decision statement: if a defined change improves a specified quality-adjusted outcome beyond the threshold, keep or expand it; otherwise stop or revise it. This structure prevents endless testing and makes the result useful even when the original hypothesis is rejected.

For Cost per View Advertising: Calculate Cost, Quality and Break-Even Value, change one major decision layer at a time when possible. Audience, message, landing page, bid strategy and conversion definition can interact, so changing all of them at once produces an outcome without a reliable explanation. When a bundled change is unavoidable, document the bundle and avoid assigning credit to one component.

For Cost per View Advertising: Calculate Cost, Quality and Break-Even Value, optimization should follow evidence maturity. First fix broken tracking, irrelevant traffic and budget leakage. Then improve message and landing continuity. Only after the outcome signal is stable should the team automate bidding or expand reach. Scaling a noisy system produces more data but not necessarily more knowledge.

Quality, invalid activity and source control

Quality controls for cost per view advertising should identify where traffic or leads originated, which placements or queries were eligible, how frequency was managed and which exclusions were applied. Source transparency matters because the same headline metric can contain very different user intent and business value.

For Cost per View Advertising: Calculate Cost, Quality and Break-Even Value, create rejection reasons for invalid, duplicate, accidental, incentivized or otherwise unusable outcomes. Feed those reasons back into media analysis without exposing sensitive customer data. A campaign that lowers raw cost while increasing rejected outcomes has not improved acquisition economics.

For Cost per View Advertising: Calculate Cost, Quality and Break-Even Value, use stop conditions for sudden spend acceleration, tracking loss, landing-page failure, abnormal geographic mix, repeated low-quality sources and material changes in accepted outcome rate. A stop rule protects both cash and data quality while the cause is investigated.

Governance and operating cadence

Governance for cost per view advertising requires least-privilege access, named account owners, change history, approval thresholds and a documented recovery process. Business-owned accounts and exportable data reduce dependency on one employee, agency or platform relationship.

For Cost per View Advertising: Calculate Cost, Quality and Break-Even Value, set a review cadence that matches decision speed. Daily checks should focus on delivery failures, budget anomalies and tracking. Weekly reviews can evaluate search terms, placements, creative fatigue and accepted outcome quality. Monthly reviews should reconcile finance, margin, attribution assumptions and channel portfolio decisions.

The highest-priority risks for cost per view advertising are changing definitions mid-test, using platform-only totals, mixing view and click attribution, ignoring reversals, averaging unlike sources, and optimizing the metric instead of profit. Give each risk a preventive control, an owner, a detection signal and a recovery action. Risk documentation is useful only when it changes how campaigns are configured and reviewed.

30-day controlled rollout

Days 1–4

Define the objective, accepted outcome, economics, audience or query hypothesis and maximum learning loss. Apply the stage specifically to cost per view advertising, and do not advance while the prior stage has unresolved tracking or quality failures.

Days 5–10

Build one campaign structure, validate tracking, approve creative and verify the landing experience on target devices. Apply the stage specifically to cost per view advertising, and do not advance while the prior stage has unresolved tracking or quality failures.

Days 11–20

Run the capped test, inspect source or query quality, reconcile outcomes and log every material change. Apply the stage specifically to cost per view advertising, and do not advance while the prior stage has unresolved tracking or quality failures.

Days 21–30

Score marginal economics, document uncertainty, choose keep, revise, pause or expand, and preserve rollback. Apply the stage specifically to cost per view advertising, and do not advance while the prior stage has unresolved tracking or quality failures.

Scaling without losing evidence

Scale cost per view advertising in stages: expand budget within the proven segment, add closely related inventory or queries, test a new audience, then test a new market or offer. Each stage should preserve a comparison group or stable reference so the team can separate genuine incremental value from normal variation.

For Cost per View Advertising: Calculate Cost, Quality and Break-Even Value, watch marginal economics during expansion. Average results often remain attractive while the newest spend is already above the break-even threshold. Report outcome quality and cost by spend band, source, geography, device, creative and cohort to reveal where additional budget stops creating value.

For Cost per View Advertising: Calculate Cost, Quality and Break-Even Value, keep rollback simple. Preserve the last stable configuration, record the exact change and avoid deleting historical identifiers. A reversible campaign can move quickly because the downside of a failed change is bounded and the learning remains available for the next decision.

Decision framework

A useful decision on cost per view advertising answers four questions: does the channel or model fit the customer intent, can the team operate the required controls, can outcomes be reconciled to business value, and does marginal performance remain above the approved threshold? A “yes” to only one question is not enough for scale.

For Cost per View Advertising: Calculate Cost, Quality and Break-Even Value, compare alternatives using weighted criteria rather than feature counts. Weight audience or query fit, inventory transparency, creative requirements, measurement, budget control, data export, support, operating effort and total cost. Document why the weights reflect the actual business instead of using a generic score.

The final output should be a keep, revise, pause or expand decision with evidence. Record the tested scope, result, uncertainty, operational limitations and next trigger. This makes cost per view advertising part of an institutional learning system rather than a sequence of disconnected campaigns.

Where FroggyAds fits

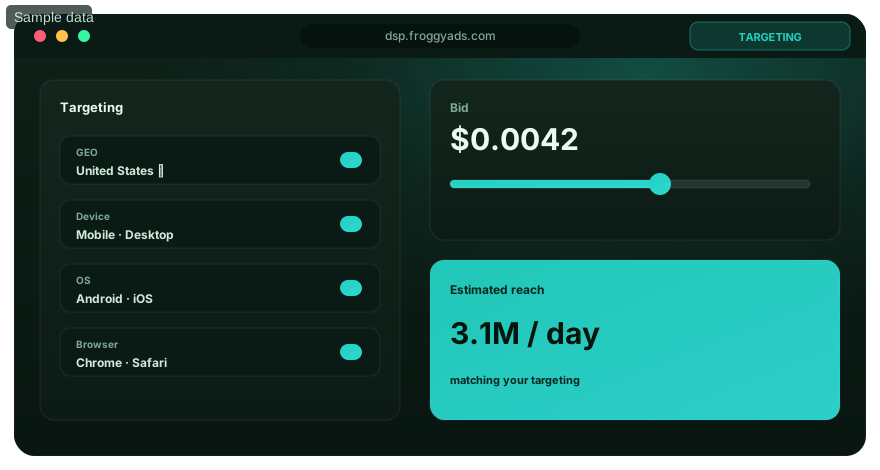
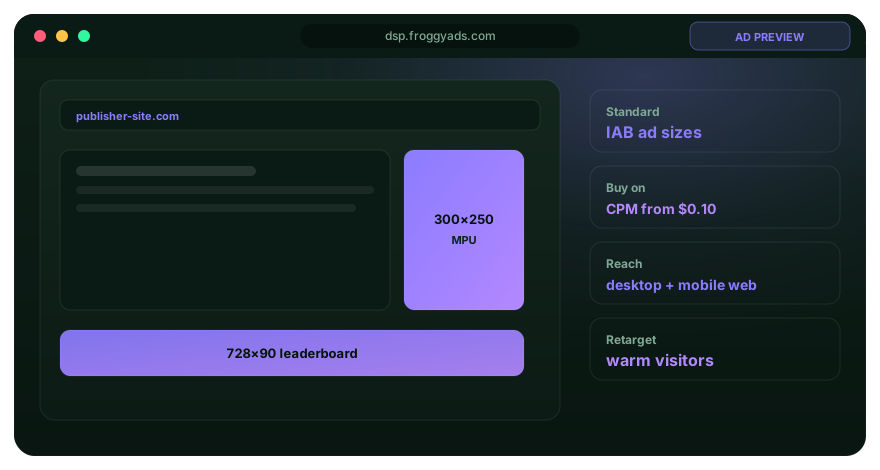
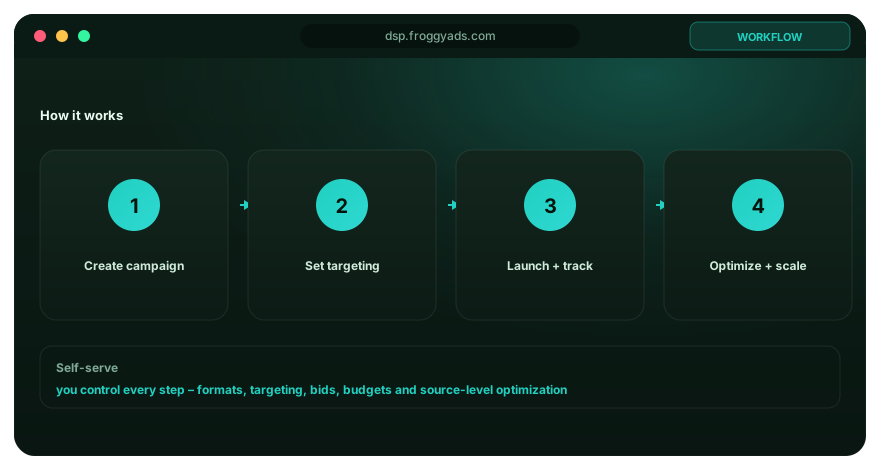
FroggyAds is a self-serve media buying platform for advertisers and media buyers. It supports campaign activation, audience and device targeting, source controls, budgeting and performance workflows across push, native, display and pop inventory. It is not presented as a PPC agency, SEO service, CRM, search engine or universal analytics system.

Use FroggyAds where self-serve paid-media execution fits the wider cost per view advertising plan. Keep business-owned conversion definitions and final value records in the accountable systems, then reconcile campaign delivery to accepted outcomes before scale.

Frequently asked questions

What is cost per view advertising?

Cost per View Advertising is the controlled process used to how video-view costs are defined, bid, measured and reconciled to qualified attention and business outcomes. It combines campaign decisions, budget controls, measurement and business reconciliation.

Who should use cost per view advertising?

Video advertisers, media buyers and campaign analysts should use it when the objective, accountable owner, approved budget and accepted outcome are defined.

How much should be spent on cost per view advertising?

Start from the maximum approved learning loss and the sample needed for a useful decision. Avoid universal budget claims because auction conditions and business economics vary.

Which metrics matter for cost per view advertising?

Use raw metric value, quality-adjusted value, accepted outcome rate, break-even value, then reconcile those measures to revenue, margin, reversals and operating capacity.

How long should a test run?

Run until the campaign has enough representative delivery and outcome maturity to make the predefined decision. Calendar time alone is not a sufficient rule.

What is the biggest risk in cost per view advertising?

A primary risk is changing definitions mid-test. Protect the test with explicit exclusions, budget limits, monitoring and stop conditions.

Does cost per view advertising guarantee results?

No. It creates a structured way to buy, measure and improve paid activity. Results still depend on market demand, offer, creative, landing experience, inventory and execution.

Should platform conversions be trusted as final outcomes?

Use them for campaign operations, but reconcile them with analytics and business records because attribution rules, duplicate events, rejection states and reversals can differ.

When should cost per view advertising be paused?

Pause when tracking fails, spend accelerates outside the plan, traffic quality changes materially, the landing experience breaks or marginal cost exceeds the approved threshold.

How should cost per view advertising be scaled?

Expand one controlled dimension at a time, preserve a stable comparison, monitor marginal economics and keep the previous configuration available for rollback.

Official sources used for this guide

For Cost per View Advertising: Calculate Cost, Quality and Break-Even Value, the framework is grounded in primary documentation for CPV and CPC, auctions, bidding, budgets, attribution, delivery metrics, ad operations, trafficking and accessible creative production.

V149 operational depth

Cost per View Advertising: Calculate Cost, Quality and Break-Even Value operating worksheet

This worksheet turns the definition into a documented, reversible process. Use the controls below with the page's formulas, examples and official references.

Definition and denominator contract

Write the operational definition for cost per view advertising: calculate cost, quality and break-even value before a report or platform is selected. Name the event, denominator, eligibility rule, time zone, currency, attribution scope and data owner. For this canonical owner, the assigned wording includes cost per view advertising. Those phrases should resolve to the same documented decision boundary rather than producing competing calculations across teams.

The definition contract for cost per view advertising: calculate cost, quality and break-even value should include examples of what is included and excluded. Record how duplicates, invalid activity, delayed events, refunds, rejected leads, view-through credit and incomplete page loads are treated. A metric or workflow becomes governable only when another analyst can reproduce the number from exported evidence and explain any difference from a platform dashboard.

Decision owner and approval path

Assign one accountable owner for each decision inside cost per view advertising: calculate cost, quality and break-even value. The owner is responsible for the input quality, the change log, the approval threshold and the rollback action. Contributors can recommend changes, but responsibility should not disappear across an agency, platform, analytics team and finance team. A named owner also makes exceptions visible instead of allowing them to become permanent undocumented settings.

Create an approval path for cost per view advertising: calculate cost, quality and break-even value that distinguishes routine optimization from material risk. Small bid, pacing or placement changes may follow a documented operating range. New conversion definitions, large budget increases, new markets, tracking changes and contractual commitments should require explicit review. The approval record should state what changed, why it changed, what evidence supported it and when the decision will be re-evaluated.

Forecast range and scenario planning

Forecast cost per view advertising: calculate cost, quality and break-even value with ranges rather than a single point estimate. Build a conservative case, an expected case and an upside case using transparent assumptions for volume, price, quality, conversion maturity and operational capacity. The model should show which assumption creates the largest change in outcome so the first test can focus on the uncertainty that matters most.

Every cost per view advertising: calculate cost, quality and break-even value forecast needs a failure case. Estimate the maximum acceptable learning loss, the earliest reliable signal, the amount of delayed outcome data and the conditions that would stop delivery. Scenario planning is valuable because it turns a budget or target into a reversible decision. It also prevents teams from treating a platform forecast as guaranteed inventory, price or business value.

Source and placement evidence

Preserve source-level evidence for cost per view advertising: calculate cost, quality and break-even value wherever the buying environment allows it. Record campaign, ad group, creative, query, placement, publisher, device, geography and time identifiers in stable exports. When a platform withholds a dimension, document the limitation and avoid making quality claims that require evidence the system cannot provide.

Analyze cost per view advertising: calculate cost, quality and break-even value by meaningful cohorts instead of relying only on account averages. A blended result can hide a strong market and a weak market, a valid placement and an accidental placement, or mature conversions and recent unqualified events. Cohort reporting should use minimum sample rules and should not expose personal data that is unnecessary for the decision.

Measurement reconciliation

Reconcile cost per view advertising: calculate cost, quality and break-even value across delivery, analytics and business systems. Delivery systems record billable events and spend. Analytics systems record sessions and attributed behavior. Business systems record accepted leads, purchases, revenue, reversals, margin and capacity effects. Differences are expected, but unexplained differences should block scale until the team understands the measurement boundary.

Create a reconciliation table for cost per view advertising: calculate cost, quality and break-even value with the platform total, analytics total, business total, variance, known cause, unresolved amount and owner. Use the same time zone, currency and maturity window before comparing systems. Preserve raw exports so a later tracking change does not rewrite the historical explanation or make an old decision impossible to audit.

Launch a controlled paid-media test

Use FroggyAds for self-serve media buying with source controls and measurable campaign execution.

Create My Free Account