
Define the decision
Write the objective, accepted outcome and maximum learning loss for viewability rate.
Calculate and interpret viewability rate with a documented denominator, measurement standard, placement breakdown and outcome-level quality review.
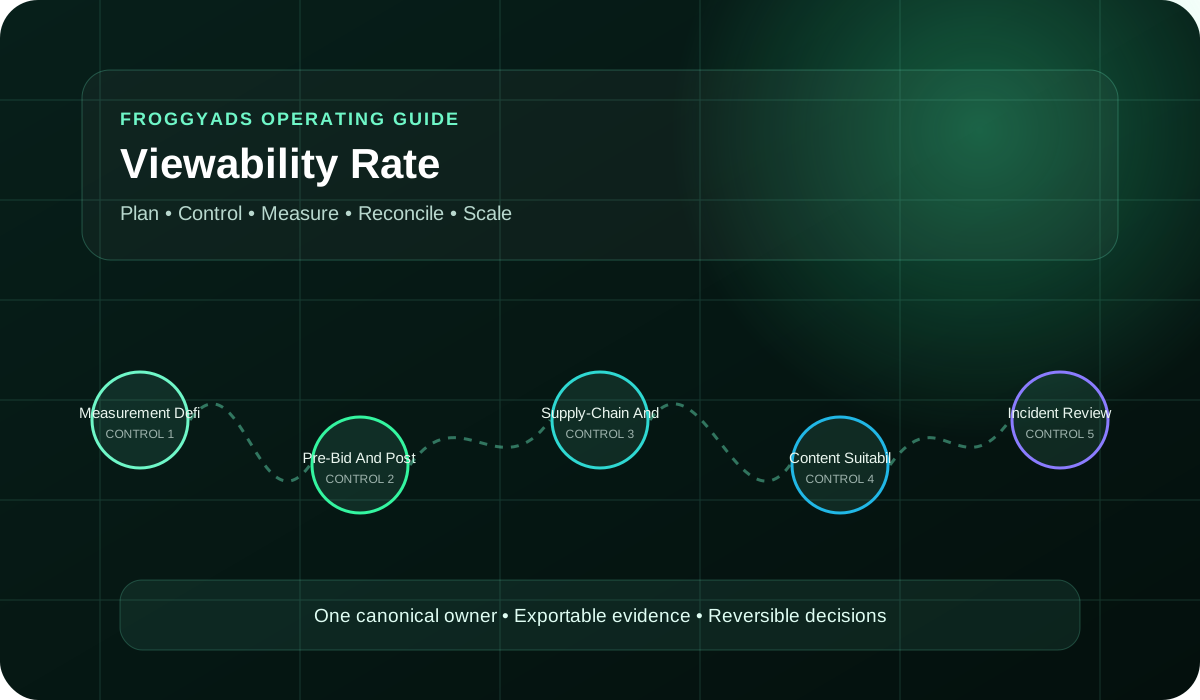
Quick answer: Viewability rate is the percentage of measurable impressions that meet the stated visibility rule. Report measurement coverage separately and do not equate a viewable impression with attention or a customer. When reviewing FroggyAds traffic with available verification data, map findings to the relevant source and compare cost and qualified outcomes before changing the campaign.
Reference for Viewability Rate: Measure Results & Optimize Spend: MRC: Standards and Guidelines.
Viewability Rate is the percentage of measurable ad impressions that satisfy the applicable pixel and time conditions within a defined measurement method.
For viewability rate, the practical job is to help buyers distinguish measurable delivery, viewable delivery, attention and business impact without collapsing them into one claim. That means separating the media action from the business outcome. Delivery, reach, impressions and clicks describe activity; accepted leads, completed purchases, retained customers or another approved business state describe value.
Before comparing viewability, record the served, measurable and viewable impression counts and the exact method used. Check whether each format and device is covered and whether invalid activity is excluded consistently. This lets you distinguish a low visibility result from a measurement gap before changing the source list or creative.
The main value of viewability rate is decision clarity. Teams can compare options only when the comparison uses the same objective, time window, maturity rule and economic definition. Without that contract, a lower reported cost may simply reflect a different event, weaker quality or incomplete conversion maturity.
The strongest plans connect measurement definition and denominator, pre-bid and post-bid controls, and supply-chain and placement evidence with content suitability and brand risk, incident review and escalation, and business-outcome reconciliation. These elements interact. A useful audience can fail with the wrong creative, a strong format can fail on unsuitable placements, and an apparently efficient campaign can fail after rejected outcomes and reversals are included. The viewability rate review should therefore connect content suitability and brand risk with viewable impression rate, a named owner and a dated change record.
Use viewability rate as a controlled learning system. The first launch should be narrow enough to explain, the change log should preserve every material decision, and the reporting should show both the platform result and the accepted business result. Scale is earned by repeated evidence, not by one favorable dashboard interval.
Build the viewability rate architecture in layers. Start with the commercial objective and accepted outcome, then define the audience or context, select the format and placement, prepare the offer and landing path, set budget and bid controls, and finish with measurement, exclusions and stop rules. Each layer needs an owner and a validation step.
Use stable names for campaigns, audiences, creatives, placements and test versions. Stable identifiers allow exports from the buying platform, analytics and business systems to be joined later. They also make it possible to distinguish a real improvement from a naming change, copied campaign or altered attribution setting. The viewability rate review should therefore connect pre-bid and post-bid controls with cost per accepted outcome, a named owner and a dated change record.
Separate exploration from exploitation. Exploration tests new placement-level viewability bands, pre-bid inventory controls, and post-bid verification reports under capped budgets. Exploitation allocates more delivery to combinations that have passed quality and economic checks. Combining both modes in one undifferentiated campaign hides where the learning budget went. For viewability rate, apply the principle through a bounded test such as placement-level viewability bands, and require viewable impression rate to support the next budget decision.
Connect the guide to live testing
Use the choices established in “Viewability Rate operating architecture” to define one audience, budget and source set in FroggyAds. Keep the surrounding offer and measurement rule stable so the test adds evidence to viewability rate instead of mixing several changes at once.
Create My Free Account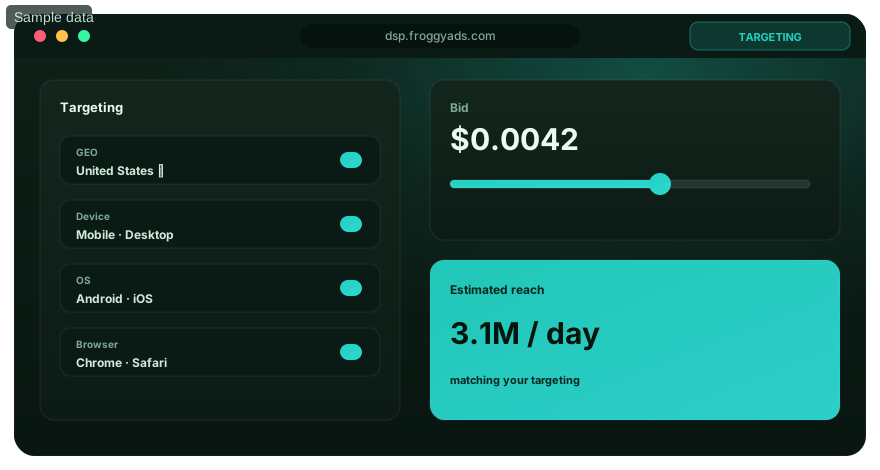
For Viewability Rate, credit a decision layer only after it has a named owner, an operating control and exportable evidence.
| Decision layer | Operating requirement | Evidence required |
|---|---|---|
| Measurement Definition And Denominator | Define the decision, input, control and exception path for measurement definition and denominator. | Written definition, owner and approval boundary. |
| Pre-Bid And Post-Bid Controls | Define the decision, input, control and exception path for pre-bid and post-bid controls. | Exportable setup, exclusions and change log. |
| Supply-Chain And Placement Evidence | Define the decision, input, control and exception path for supply-chain and placement evidence. | Creative and landing continuity evidence. |
| Content Suitability And Brand Risk | Define the decision, input, control and exception path for content suitability and brand risk. | Source or cohort reporting with quality review. |
| Incident Review And Escalation | Define the decision, input, control and exception path for incident review and escalation. | Reconciled analytics and business outcomes. |
| Business-Outcome Reconciliation | Define the decision, input, control and exception path for business-outcome reconciliation. | Marginal scale result with rollback readiness. |
Delivery quality for viewability rate depends on how the platform identifies users, placements, creative states and measurable events. Record these technical boundaries before interpreting the result. Identity approximation, unavailable signals and unmeasurable inventory should remain visible in reporting.
Evaluate distribution, not only averages. Break results into exposure bands, placements, devices, creative variants, audience stages and time. The distribution often reveals saturation, low-viewability inventory, broken dynamic combinations or a small cohort carrying the entire blended result. For viewability rate, apply the principle through a bounded test such as brand-suitability allowlists and exclusions, and require cost per accepted outcome to support the next budget decision.
Use automation within guardrails. Approved inputs, fallback creative, caps, exclusions, source review and rollback protect the campaign when a model or delivery system behaves differently from the forecast. Automation should expand controlled decisions, not remove accountability. The viewability rate review should therefore connect content suitability and brand risk with viewable impression rate, a named owner and a dated change record.
Write the objective, accepted outcome and maximum learning loss for viewability rate.
For Viewability Rate, document the audience, context, placement, GEO, device or prior behavior that makes delivery eligible.
For Viewability Rate, build format-specific assets, proof, call to action and a landing path that continues the same promise.
For Viewability Rate, test delivery, analytics, conversion, acceptance, deduplication and delayed states end to end before campaign decisions depend on reporting.
For Viewability Rate, set explicit test budgets, bid ranges, exclusions, frequency limits and dated review checkpoints before delivery begins.
For Viewability Rate, compare source, placement, audience, device, creative and exposure-level quality before keep, cap, exclude or retest decisions.
For Viewability Rate, expand one controlled dimension when marginal economics pass; otherwise return to the last stable configuration.
Creative for viewability rate should make one credible promise to one recognizable audience state. The headline or opening frame identifies the problem or opportunity, the supporting element supplies proof, and the call to action describes the next step. Avoid claims that the landing page cannot substantiate.
Prepare variations around meaningful hypotheses rather than cosmetic changes. Test a different proof point, customer problem, product benefit, objection, offer structure or format adaptation. Preserve enough consistency that the team can identify which idea changed response quality. For viewability rate, apply the principle through a bounded test such as brand-suitability allowlists and exclusions, and require cost per accepted outcome to support the next budget decision.
Landing continuity is part of the creative system. The destination should repeat the same terminology, offer and expectation introduced in the ad. If viewability rate produces clicks but the landing page changes the promise, hides the action or loads poorly on the target device, the campaign is not ready for scale.
Choose the execution format
Use the criteria around “Creative, offer and landing continuity” to decide whether push, native, display or pop fits the message and destination. Set format, targeting and spend as campaign controls in FroggyAds while the viewability rate decision remains the standard for judging the result.
Create My Free Account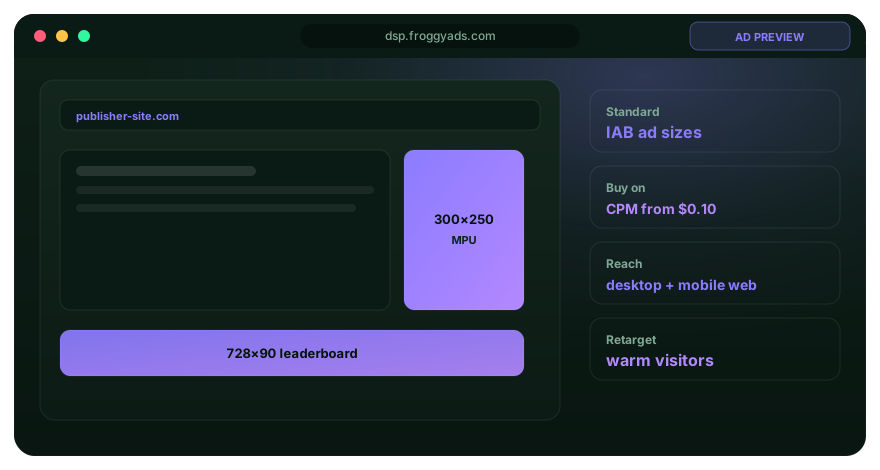
Measure viewability rate through a chain rather than a single rate: eligible delivery, measurable exposure, qualified interaction, landing completion, primary conversion, accepted outcome and realized value. The chain reveals where volume becomes unusable and prevents a strong top-line metric from masking downstream weakness.
The core reporting set includes measurable impression rate, viewable impression rate, invalid traffic rate, verified delivery rate, accepted conversion rate, and cost per accepted outcome. Define each metric's numerator, denominator, data source, time zone, currency, attribution rule and maturity window. Where a platform metric cannot be reproduced from exportable evidence, label the limitation instead of presenting false precision. For viewability rate, apply the principle through a bounded test such as post-bid verification reports, and require verified delivery rate to support the next budget decision.
Reconcile platform, analytics and business records on a regular schedule. Differences are expected because systems use different identity, attribution and validation rules. Unexplained differences should block aggressive scale until the team knows whether the variance comes from tracking, delayed events, duplicates, rejected outcomes or reversals. The viewability rate review should therefore connect pre-bid and post-bid controls with cost per accepted outcome, a named owner and a dated change record.
For Viewability Rate, define every decision metric with a numerator, denominator, source, reporting window, currency, attribution rule and maturity condition.
| Metric | Definition requirement | Diagnostic check |
|---|---|---|
| Measurable Impression Rate | State numerator, denominator, source, time window, currency and maturity rule. | Check for treating one vendor score as proof before the metric receives decision credit. |
| Viewable Impression Rate | State numerator, denominator, source, time window, currency and maturity rule. | Check for mixing incompatible measurement methods before the metric receives decision credit. |
| Invalid Traffic Rate | State numerator, denominator, source, time window, currency and maturity rule. | Check for reviewing only blended averages before the metric receives decision credit. |
| Verified Delivery Rate | State numerator, denominator, source, time window, currency and maturity rule. | Check for failing to preserve placement evidence before the metric receives decision credit. |
| Accepted Conversion Rate | State numerator, denominator, source, time window, currency and maturity rule. | Check for optimizing before conversion maturity before the metric receives decision credit. |
| Cost Per Accepted Outcome | State numerator, denominator, source, time window, currency and maturity rule. | Check for confusing filtered delivery with guaranteed business quality before the metric receives decision credit. |
Set the economic boundary for viewability rate before launch. Estimate expected value per accepted outcome, gross margin, operating capacity, refund or rejection risk and the maximum loss allowed for learning. The budget becomes a controlled experiment only when the team knows what would make the test financially acceptable or unacceptable.
Use a break-even relationship that the business can audit: maximum acquisition cost equals expected contribution per accepted outcome multiplied by the probability that the measured event becomes that accepted outcome. Replace broad platform conversion counts with the state that actually creates value. The viewability rate review should therefore connect business-outcome reconciliation with verified delivery rate, a named owner and a dated change record.
Evaluate marginal performance when scaling. Average cost can remain attractive while the newest spend enters weaker audiences, placements or frequency bands. Compare the next budget increment with the approved threshold and keep the prior configuration available for rollback. For viewability rate, apply the principle through a bounded test such as brand-suitability allowlists and exclusions, and require cost per accepted outcome to support the next budget decision.
Quality control for viewability rate includes inventory review, placement evidence, invalid-activity monitoring, creative compliance, landing integrity and outcome acceptance. No single vendor label proves quality. The buyer needs source-level or cohort-level evidence that can be connected to business results.
Privacy and governance are design inputs, not final checkboxes. Use only permitted data, minimize unnecessary identifiers, document membership and deletion rules, and avoid inferring sensitive personal characteristics. A targeting or retargeting feature should be rejected when the business purpose does not justify the data use. A practical viewability rate brief can operationalize this step with pre-bid inventory controls, while treating failing to preserve placement evidence as an explicit pre-launch risk.
Accessibility supports both user value and campaign reliability. Text, contrast, motion, controls and landing forms should remain understandable across devices and assistive technologies. Deceptive interaction patterns may increase accidental clicks while reducing trust and accepted outcomes. In a viewability rate workflow, this control is most valuable when confusing filtered delivery with guaranteed business quality could otherwise make the reported result look stronger than the accepted business outcome.
The common failure modes for viewability rate include treating one vendor score as proof, mixing incompatible measurement methods, and reviewing only blended averages. These failures often look like media problems but originate in planning, data or measurement. Diagnose the earliest broken stage before changing bids or increasing creative volume.
A second group of risks includes failing to preserve placement evidence, optimizing before conversion maturity, and confusing filtered delivery with guaranteed business quality. Protect the campaign with exclusions, budget limits, named owners, change logs and predefined stop conditions. The goal is not to eliminate uncertainty; it is to keep uncertainty visible and financially bounded. For viewability rate, apply the principle through a bounded test such as placement-level viewability bands, and require viewable impression rate to support the next budget decision.
When results weaken, compare the current period with a stable cohort. Check tracking, audience or placement mix, frequency distribution, creative age, landing performance, conversion lag and accepted-outcome rules. A disciplined diagnostic sequence prevents a team from solving the wrong problem. The viewability rate review should therefore connect business-outcome reconciliation with verified delivery rate, a named owner and a dated change record.
Put the guide into practice
With “Common failure modes and diagnostic order” documented, launch only the next reversible test. Set a spending limit, preserve the baseline and use source-level and audience controls so the next step depends on qualified outcomes for viewability rate, not activity volume.
Create My Free Account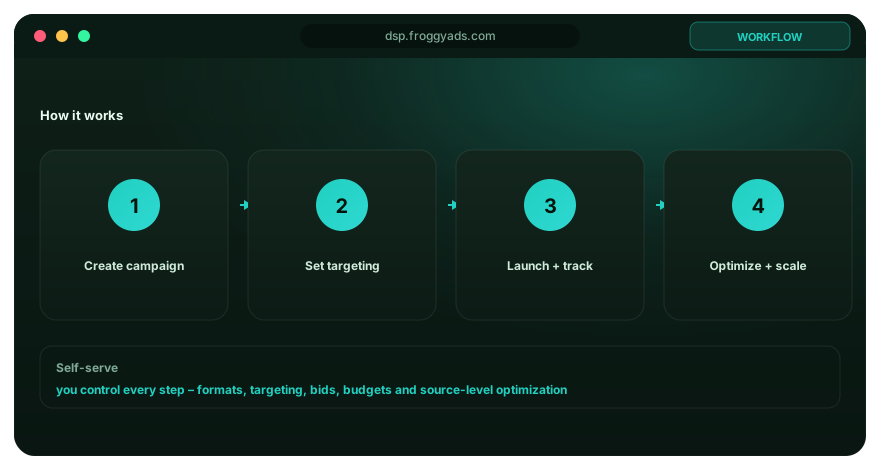
For viewability rate, this failure weakens evidence or business quality. Record the earliest observable signal, the accountable owner, the corrective action and the condition that confirms recovery before spend is expanded.
Freeze the viewability rate definition, outcome state, conversion map, source naming, exclusions and initial budget. Test events from impression or eligibility through accepted business outcome.
Launch a narrow viewability rate test with a stable control. Review pacing, placements, audience overlap, creative rendering, landing performance and early quality signals without overreacting to small samples.
For Viewability Rate, diagnose one issue at a time with a meaningful creative, targeting, placement, bid or landing hypothesis while preserving a control and waiting for conversion maturity.
For Viewability Rate, reconcile accepted outcomes before each budget increase; expand one dimension only when the evidence is reproducible and operating capacity can support it.
Scale viewability rate one controlled dimension at a time. Expand budget, audience, geography, format, placement or creative inventory separately enough that the effect can be observed. Preserve a control and compare marginal outcomes, not only the blended account average.
A valid scale decision requires capacity as well as media efficiency. Confirm that sales, fulfillment, support, inventory, payment and compliance systems can absorb the expected outcome volume. Media that exceeds operational capacity may create lower-quality service, refunds or rejected leads that erase the apparent gain. A practical viewability rate brief can operationalize this step with invalid-traffic anomaly review, while treating confusing filtered delivery with guaranteed business quality as an explicit pre-launch risk.
Keep rollback simple. Store the last stable settings, creative set, audience rules and exclusions. If marginal cost, quality, tracking variance or operational load crosses the approved threshold, return to the stable configuration and investigate before another expansion. In a viewability rate workflow, this control is most valuable when mixing incompatible measurement methods could otherwise make the reported result look stronger than the accepted business outcome.
Our campaign and source controls let you act on a placement finding when it can be mapped to the traffic you are buying. Confirm which verification data is available in your actual setup, then compare the same source's visibility, cost and customer outcomes. We do not treat a reference to a measurement standard as proof of a named integration, accredited measurement or viewable-only billing.
Use FroggyAds as the execution layer, not as a substitute for the operating contract. Bring a defined objective, approved creative, landing page, tracking plan, exclusions and accepted outcome. Start with a bounded test, review source-level evidence and expand only after the business result is reconciled. For viewability rate, apply the principle through a bounded test such as post-bid verification reports, and require verified delivery rate to support the next budget decision.
The minimum deposit is $50, while a useful learning budget depends on format, market, bid level, conversion rate and the evidence needed for a decision. Avoid treating a minimum funding amount as a recommendation or a guarantee of statistically stable results. The viewability rate review should therefore connect pre-bid and post-bid controls with cost per accepted outcome, a named owner and a dated change record.
It estimates how many measurable impressions met the chosen opportunity-to-see criteria under the vendor's method. The result helps compare delivery conditions by source or placement. It does not show that a person paid attention, understood the message or completed the advertiser's business outcome.
Divide viewable impressions by measurable impressions and multiply by 100, using the report's stated method. In a hypothetical campaign with 100,000 served, 80,000 measurable and 48,000 viewable impressions, viewability is 60% and measurement coverage is 80%. The viewable share of all served impressions is 48%, a different calculation. Show all three counts so a strong rate does not conceal limited measurement coverage.
Align the measurement standard, eligible formats, denominator, sampling, treatment of missing data, device and placement mix, date range and invalid-traffic rules. Review coverage as well as the rate. Two vendors can report different figures because they measured different populations or used different technical methods.
No. It indicates a greater measured opportunity for the creative to appear under the stated rule, but audience fit, placement context, message, frequency, destination and offer still shape results. Read viewability beside qualified outcomes and cost; a visible impression can remain commercially irrelevant.
No. Unmeasurable means the system could not establish the required measurement; non-viewable describes a measured impression that did not meet its visibility conditions. Browser, application, format or integration limits can affect coverage. Keep those groups separate when reviewing FroggyAds source traffic with your available verification reports. Do not treat missing measurement as proof of either good visibility or a bad placement.
A rule defines a technical opportunity to see the ad, not attention. For example, Google's Active View documentation describes ordinary display viewability as at least 50% of the ad's pixels visible for one second, and video as at least 50% for two seconds. Confirm the method used by your actual report and any applicable exceptions; these reference criteria do not establish FroggyAds' billing rules or guarantee that a customer noticed the message.
Include the definition and standard, served, measurable and viewable counts, formula, coverage, date range, device, format, source or placement detail, invalid-traffic treatment and material method changes. Add cost and campaign outcome context. The buyer needs counts and conditions, not a percentage alone.
Investigate when a source falls materially below the prewritten threshold for enough measurable delivery, changes sharply from its own pattern or combines low opportunity with weak outcomes. Check rendering, page position, device and coverage before exclusion. Preserve source evidence so the issue can be reproduced.
No. The metric describes a technical opportunity under defined visibility conditions, not human attention, understanding or recall. Use suitable attention research or downstream behaviour for those questions and keep their limitations clear. Do not relabel a viewable impression as a confirmed person who saw the message.
Connect the verification report to identifiable sources or placements where that mapping is available, then compare coverage, cost and qualified customer outcomes. Our source controls let you investigate or restrict a specific supply group rather than change the whole campaign from one percentage. Confirm which verification fields your setup provides; do not assume a named vendor integration or viewable-only charging model. Increase spend when the customer result and the measured delivery support it.
For Viewability Rate, use current primary platform, industry-standard and accessibility documentation; verify interfaces, policy terms, implementation steps and terminology before launch.
Use the Viewability Rate worksheet to turn guidance into a documented process with a named owner, evidence requirement, decision rule, rollback point and review date.
Write the operational definition for viewability rate before choosing a dashboard. Name the event, denominator, eligibility rule, attribution scope, time zone, currency and data owner. The assigned keyword wording is viewability rate; those phrases must resolve to one canonical decision boundary rather than competing calculations.
For Viewability Rate, keep evidence exportable, reproducible and clear enough for a reviewer who did not configure the campaign.
Document why each signal is relevant to viewability rate, how it is collected or inferred, how long it remains valid and which exclusions prevent waste or policy risk. Mark overlap between prospecting, retargeting, customer and suppression groups so the same user state is not purchased repeatedly without intent.
List every approved promise, proof source, format adaptation, call to action and landing destination for viewability rate. Include size or device constraints, fallback creative, accessibility checks and the owner who can withdraw a claim or asset when the underlying evidence changes.
Model conservative, expected and upside cases for viewability rate using transparent assumptions for eligible reach, price, response quality, conversion maturity and accepted value. Add a failure case with the maximum learning loss, earliest reliable signal and conditions that stop delivery.
Preserve campaign, audience, placement, publisher or source, device, geography, creative and time identifiers where the buying environment allows it. When a dimension is unavailable, record the limitation and avoid quality claims that require evidence the platform does not provide. In a viewability rate workflow, this control is most valuable when confusing filtered delivery with guaranteed business quality could otherwise make the reported result look stronger than the accepted business outcome.
Create a reconciliation table for viewability rate with platform delivery, analytics events, business outcomes, variance, known cause, unresolved amount and accountable owner. Use the same time zone, currency and maturity window before comparing systems.
For every material change to viewability rate, record the observed problem, hypothesis, exact change, start time, expected signal, minimum evidence, result and rollback decision. This record protects learning across operators, agencies and copied campaigns.
Before expanding viewability rate, confirm that marginal economics pass, inventory or audience quality remains stable, frequency is controlled, creative coverage is sufficient, operations can absorb outcomes and the previous stable configuration can be restored quickly.
For the paid-acquisition side of Viewability Rate, FroggyAds provides self-serve campaign controls, source-level reporting, conversion tracking and budget ownership.
Create My Free AccountThis URL has one primary job for performance-focused advertisers: understand the control and decide when to use it. Keep this page focused on that buying decision instead of turning it into a generic advertising article. For Ad Viewability Measurement, connect this point to the concrete objective to understand the control and decide when to use it, with the source and outcome evidence retained for this URL.
To complete the Viewability Rate: Calculate, Diagnose and Improve Visible Delivery decision context, keep conversion action, conversion window, source-level reconciliation and backend acceptance visible as operating concepts. They matter here because they change how the buyer interprets setup, delivery or accepted outcomes.
| Step | Feature Control workflow | Evidence to retain |
|---|---|---|
| 1 | State the problem the control is meant to solve | Keep the evidence tied to Viewability Rate: Calculate, Diagnose and Improve Visible Delivery and the accepted outcome defined for this URL. |
| 2 | Apply the control with a written rule and rollback condition | Keep the evidence tied to Viewability Rate: Calculate, Diagnose and Improve Visible Delivery and the accepted outcome defined for this URL. |
| 3 | Measure its effect on delivery and accepted outcomes before making it permanent | Keep the evidence tied to Viewability Rate: Calculate, Diagnose and Improve Visible Delivery and the accepted outcome defined for this URL. |
Hypothetical example: if a controlled Viewability Rate: Calculate, Diagnose and Improve Visible Delivery test spends USD 250 and records 6 accepted outcomes after the same review window, accepted CPA is USD 250 divided by 6 = USD 41.67. Replace the example inputs with your own economics; this is not a FroggyAds performance claim.
Use FroggyAds as the execution layer only when the page's decision calls for paid traffic. Set the relevant budget, targeting and format controls, verify conversion tracking, keep source-level evidence, and increase spend only when the accepted outcome supports the next step. Create your free FroggyAds account. For Ad Viewability Measurement, connect this point to the concrete objective to understand the control and decide when to use it, with the source and outcome evidence retained for this URL.
Viewability Rate: Calculate, Diagnose and Improve Visible Delivery is a campaign-control decision: state the problem the control solves, define the rule before enabling it, and measure its effect on delivery and accepted outcomes.