
Push Ads For Affiliates
An affiliate operator should connect the push creative ID to the approved offer, source, tracker event and final network disposition.
Reach eligible audiences through classic web push or in-page push inventory. The two formats differ in permission, delivery and rendering. FroggyAds publishes push starting bids from $0.003 per click; check current pricing and the live account before launch.
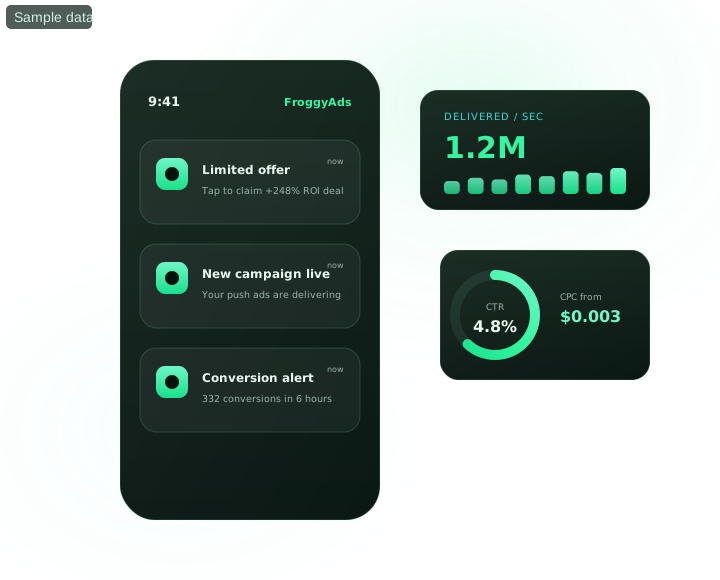
Quick answer: Learn how push ads works, what to evaluate, which quality and cost metrics matter, and how to launch a controlled campaign with measurable outcomes. Reach opted-in users with native push notifications on desktop and mobile. Push delivers some of the strongest click-through rates in performance advertising – bids start from just $0.003 per click. Push ads appear as native notifications on a user's device – outside the browser window – for audiences who have explicitly opted in to receive them. Because subscribers chose to receive notifications, push traffic tends to be highly engaged and resistant to banner blindness.
| Section | Distinct excerpt from this page |
|---|---|
| High-intent reach | Subscribers opted in, so your message lands with users who want updates – not interruptive overlays. |
| Cross-device delivery | Serve the same campaign across desktop, Android and mobile web with device-level bid control. |
| Full creative control | Test icons, titles, descriptions and images to find the combination that drives the most clicks. |
Reference for Buy Push Ads Traffic from $0.003 CPC: FTC guidance on online advertising and marketing.
Push ads are compact paid messages delivered through either classic web-push subscriptions or in-page placements that use a notification-like layout. The distinction matters. The W3C Push API defines background push messages to a web application, while the WHATWG Notifications standard defines notification display and permission. In-page push is rendered inside a page and does not prove that the user granted browser-notification permission. Confirm the format selected in the live FroggyAds account before describing the audience or delivery. A typical unit uses a short title, body, icon or image and a destination, subject to current interface limits. FroggyAds publishes push starting bids from $0.003 CPC, but a starting bid is not a traffic, engagement or conversion forecast. Test classic and in-page delivery separately, preserve campaign and creative IDs through the landing path, and judge each source by validated accepted outcomes rather than clicks alone.
A push message reaches notification-style inventory with limited space, so the title and body must identify the offer before the recipient opens the destination.
Inspect classic and in-page push delivery on the actual supported devices instead of assuming that one notification path represents every surface.
Treat the icon, title, body and optional image as distinct test fields. Change one message concept while the destination and acceptance rule remain fixed.
A push brief should state the delivery type, field limits, advertiser identity, destination release, schedule and the event that closes the test.
Begin push analysis with delivery mechanics and local time, then separate source, device and creative evidence before altering the campaign cap.
Use location settings only for eligible customer routes, and record which clock governs delivery when the recipient's local time affects the message.
Divide push cohorts by device or operating system when notification support, icon rendering or destination behaviour creates a real technical difference.
Browser data can explain classic web-push permission and receipt patterns. In-page push requires its own rendered-surface check.
Test carrier or connection distinctions only when the compact message or destination has a documented delivery reason for that split.
Category selection provides a supply context for push delivery; it does not prove that a recipient qualifies for the advertiser's offer.
Retain push source and placement identifiers through the accepted event so a keep, block or retest decision can be traced to evidence.
Use the live push buying configuration to set the initial cap, then judge cost at validated receipt, landing and accepted-outcome stages.
Launch push with a named delivery-type cell, one message concept, a compatible destination and a schedule the reviewer can reproduce.
Confirm current account funding requirements, then reserve a small push amount for message rendering, click identity and backend receipt checks.
A vertical belongs in push only when the compact wording can state the real offer without false urgency, personal imitation or missing conditions.
Push ads introduce an offer through a compact notification-style message and send interested users to your destination. With FroggyAds, you can test the message, target eligible audiences and compare traffic sources from a self-serve account. Choose this format when a short, clear benefit can earn a relevant click, then measure whether those visits become the leads, sales or signups your business needs.
Classic web push depends on browser-notification permission and supported delivery conditions. In-page push appears within a website using a notification-like design; it does not mean the visitor subscribed to browser notifications. We describe both so you can choose and test the correct inventory. Keep their results separate because the placement, user experience and available devices can differ.
Our published Push entry bid starts at $0.003 CPC, or cost per click. It is a starting bid, not a fixed rate for every country or source. Fund your account from the $50 minimum deposit and set a separate campaign budget. Use actual click and conversion costs from your test to decide which traffic merits further spend.
Prepare a title, description, icon, destination URL and a main image where the selected format supports it. Our published briefing guidance recommends roughly 30 characters for the title and 45 for the description, but check the current campaign fields for actual limits. Preview the message at its displayed size so truncation does not hide the benefit or an important qualification.
Lead with the real benefit and make the next action specific. Match the message to the approved offer, its price conditions and the country you are targeting. Avoid invented urgency, fake system alerts or wording that imitates a personal message. On FroggyAds, test distinct message ideas against the same destination and judge them by approved affiliate outcomes, not curiosity clicks alone.
You can buy available push advertising inventory through FroggyAds without first building your own notification audience. That is different from sending updates to people who subscribed directly to your website. Do not describe purchased traffic as subscribers to your brand merely because notification permission exists elsewhere. Start with the offer, creative and landing page you want new prospects to see.
Do not assume identical delivery or rendering. Classic and in-page formats use different surfaces, and text or images can appear differently across supported devices. Use our device, operating-system and browser controls to keep the campaign compatible with your destination. Check the selected inventory and preview the real message before treating one device's result as representative of all users.
A compelling short message can attract attention without explaining the whole offer. Check that the landing page immediately confirms the benefit, loads on the targeted device and presents an easy next step. Then verify tracking and compare creative and source results. Fix the mismatch you find rather than increasing the budget simply because the click-through rate looks strong.
Keep the destination and essential targeting stable while testing a different benefit, title or image. Track which creative produced each result and allow time for leads, purchases or affiliate approvals to be confirmed. Our campaign reporting helps you connect message performance with spending. Prefer the version that brings worthwhile customers over one that merely generates more clicks.
Create your free FroggyAds account, choose the push delivery type and prepare a focused offer. Add suitable creative, essential targeting, a bid and a campaign budget. Test the click-to-conversion journey before submitting for review. Once traffic arrives, use source-level results to decide which messages to improve and where to allocate your next test budget.
A second format should answer a different communication job, not inflate the push result. Maintain independent creative and accepted-outcome ledgers.
Native can test a feed-based recommendation, while push retains the notification-style control and its own title, icon and timing evidence.
Pop inventory can test destination-led presentation at broad scale, but its exposure path must not be merged with push notification delivery.
Interstitial delivery provides a transition-screen comparison; evaluate it under a separate cap from the compact push message.
Open the account, verify the displayed funding and bid conditions, and commit the first push spend only after the message fields are approved.
Use the push-delivery review route through the primary buy traffic guide to compare formats, targeting controls, starting prices, source-quality checks, budgets and the step-by-step FroggyAds self-serve workflow.
The dashboard should expose each push creative and source decision as a dated record, allowing the operator to reverse an unsupported allocation.
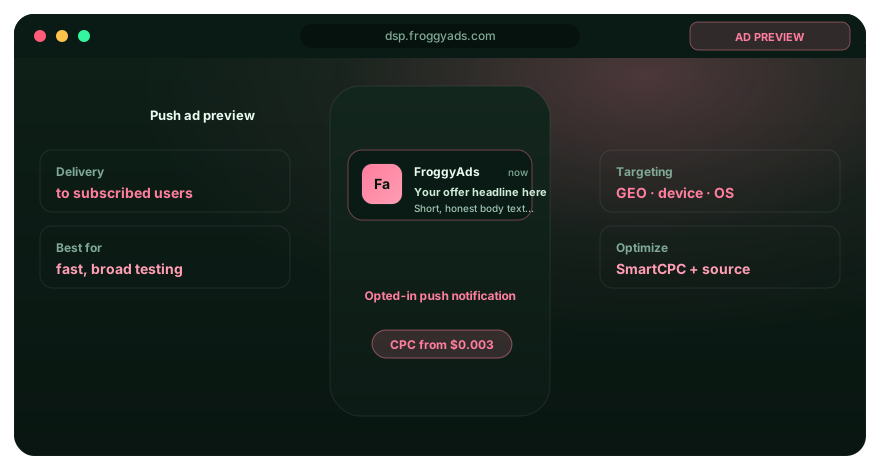
Choose a push playbook by notification objective, delivery surface and mature outcome, then keep schedule and message version attached to every result.
Affiliate push testing requires an approved offer, honest urgency, preserved click identity and the affiliate network's final acceptance status.
For app installs, match the push message to the supported store and device route, then measure attributed installation and retained use separately.
B2B push work should state the professional problem in limited message space and qualify the resulting lead inside the advertiser's system.
A brand-awareness push cell should define the observable exposure and follow-up signal without presenting notification receipt as business value.
Direct-response push creative should place the real action and limitation early, then preserve the exact title-body version through outcome review.
An ecommerce push message should match the available product, price condition and checkout path shown on its assigned landing release.
A lead-generation push campaign needs a written acceptance rule, because a submitted form alone cannot settle source quality.
Local-business push delivery should use only serviceable locations and schedules that the advertiser can support after the click.
Retargeting through push requires verified audience handling and wording that does not reveal or infer sensitive activity.
Subscription push acquisition should disclose the recurring action on the destination and retain later cancellation evidence with the cohort.
The focused push guides isolate copy, campaign creation and landing-page receipt so each operational question can be reviewed on its own evidence.
Use push examples to review message composition, the size reference for asset limits, and the cost guide for the current buying basis.
A platform comparison for push should record delivery types, message fields, scheduling controls, source visibility, funding and the event export path.
Mechanics guides distinguish classic web push, in-page rendering and comparisons with feed, banner or pop delivery.
Buyer and publisher references separate campaign access from supply participation, preventing one role's terms from being applied to the other.
Platform and cost pages frame notification inventory, account setup and buying units; the live interface supplies the current operational readback.
Affiliate and app-developer push guides use different destination and acceptance evidence even when both begin with a compact notification message.
An affiliate operator should connect the push creative ID to the approved offer, source, tracker event and final network disposition.
An app developer should connect push delivery type to supported device, store receipt, install attribution and retained-user measurement.
A beginner should test one truthful push message, verify its rendered notification and record the complete click-to-outcome path before iterating.
A blogger using push should define the promised update, destination subject and opt-in boundary, then assess whether the visit continues meaningfully.
A media buyer needs a push ledger containing delivery type, schedule, creative version, source, cap and mature accepted cost.
A small business should coordinate push timing with service hours, limit geography to reachable customers and own every resulting enquiry.
Agency and small-site guides separate client governance from the technical limits of a lower-volume destination.
An agency should preserve client approval, push asset version, account ownership and outcome definitions independently for every advertiser.
A small website should validate push landing speed, identifier receipt and a stable action before using a scarce sample for allocation.
A new-website push plan begins with destination function, event receipt and conservative caps because no mature source baseline exists yet.
A new site should prove notification-to-page continuity and backend acceptance before judging the message by click rate or requesting more volume.
URL boundary for Push ads for permission-based and in-page delivery.: This URL owns Push ads for permission-based and in-page delivery.; How Do Push Ads Work is the nearest neighboring topic and should keep its separate task. Use this page only for the decision implied by Push ads for permission-based and in-page delivery..
Use Push ads for permission-based and in-page delivery. to narrow the paid-acquisition decision before spend expands. A performance advertiser should be able to plan the market-specific test and measurement rules from this URL's own evidence.
Decision inputs for Push ads for permission-based and in-page delivery.: campaign objective, audience targeting, source evidence, conversion tracking. Keep these inputs tied to accepted conversion or business-value event and the page-specific job: plan the market-specific test and measurement rules.
Market test design for Push ads for permission-based and in-page delivery.: Use a bounded launch to learn whether this market belongs in the media plan, not merely whether impressions or visits are available. Treat campaign objective as a controlled input rather than a label: its campaign value comes from the downstream evidence attached to the same source record.
Market evidence and next action for Push ads for permission-based and in-page delivery.: Reconcile audience targeting with accepted conversion or business-value event at one review horizon; do not compare a fresh cohort with an older cohort as if timing were equal. Convert the review into an explicit keep, refine, exclude or expand decision and write the rollback condition before increasing exposure.
Push ads for opted-in audiences: at a glance is an evidence checkpoint for Push ads for permission-based and in-page delivery.. To answer “What are push ads, and why buy them through FroggyAds?”, keep campaign objective in the same campaign record and use it to plan the market-specific test and measurement rules.
What are push ads? is the measurement checkpoint for this URL. Resolve “How is classic web push different from in-page push?” while retaining audience targeting, conversion tracking, spend and cohort age so the result can be reconciled with accepted conversion or business-value event.
Why can push ads earn attention and convert? is the action checkpoint for Push ads for permission-based and in-page delivery.. Before acting on “What is the starting cost for a FroggyAds push campaign?”, document source evidence, the resulting campaign action and the rollback or retest condition.
| Page checkpoint | How to use it | Evidence to retain |
|---|---|---|
| Push ads for opted-in audiences: at a glance | Use Push ads for opted-in audiences: at a glance to establish the first evidence boundary for Push ads for permission-based and in-page delivery.; then record which part of campaign objective, targeting, source evidence, conversion tracking and economics it changes. | Keep campaign objective, source/campaign ID and the accepted-event definition together. |
| What are push ads? | Use What are push ads? as the second checkpoint and reconcile it with accepted conversion or business-value event before changing budget or source allocation. | Retain audience targeting, spend, timestamp/cohort age and accepted/rejected outcomes. |
| Why can push ads earn attention and convert? | Use Why can push ads earn attention and convert? as the final checkpoint: if it does not change the evidence for accepted conversion or business-value event, keep the test narrow rather than scaling. | Document source evidence, the decision taken and the rollback or retest condition. |
Hypothetical example: For Push ads for permission-based and in-page delivery., a hypothetical controlled cell that spends USD 270 and records 9 accepted conversion or business-value event after the same maturity window has an accepted cost of USD 30.00 per outcome. Replace the figures, outcome and review window with your own economics; this is not a FroggyAds performance claim.
Use FroggyAds to turn the Push ads for permission-based and in-page delivery. decision into a measurable traffic test with budget and source controls; downstream accepted conversion or business-value event remains the reason to scale. Create your free FroggyAds account.
Push ads for permission-based and in-page delivery. should be evaluated market by market: define eligible geography, keep measurement consistent, and scale only where accepted-outcome economics remain viable.