
Fill Rate Ad Network: Measure Demand Without Hiding Value
Evaluate ad network fill rate with eligible requests, matched requests, rendered impressions, latency and net revenue in the same report.

What does this page explain about Fill Rate Ad Network: Measure Demand Without Hiding Value?
Quick answer: Evaluate ad network fill rate with eligible requests, matched requests, rendered impressions, latency and net revenue in the same report. The central risk is maximizing fill with low-value demand that reduces page quality or blocks better opportunities. Define the formula for fill rate ad network by keeping placement, geography, device, format and demand partner visible and recording how the change affects eligible requests, matched requests, rendered impressions, net ecpm and latency. In this fill rate ad network decision, use rendered monetized impressions divided by eligible requests as the economic check.
| Section | Distinct excerpt from this page |
|---|---|
| What fill rate ad network should accomplish | That job stays measurable only when the team declares the denominator and keeps placement, geography, device, format and demand partner visible in the report. |
| Protect the audience and advertiser value | Measure those effects alongside rendered monetized impressions divided by eligible requests. |
| Five mistakes that weaken fill rate ad network | Optimizing a headline metric before the placement, geography, device, format and demand partner breakdown is stable. |
Reference for Fill Rate Ad Network: Measure Demand Without Hiding Value: Google Active View overview Viewability measurement.
What fill rate ad network should accomplish
Fill Rate Ad Network: Measure Demand Without Hiding Value is not a single ad tag, rate card or placement decision. It is an operating system for deciding which opportunities are eligible, which demand can compete, how revenue is counted and what audience cost is acceptable. The primary job on this page is to understand how much eligible inventory becomes a real monetized impression. That job stays measurable only when the team declares the denominator and keeps placement, geography, device, format and demand partner visible in the report.
Start with the business constraint behind fill rate ad network. A publisher may need more collected revenue, better payment reliability, stronger viewability, lower latency or more control over the advertiser and format mix. Those problems require different solutions. Write the constraint before adding technology. Then create one baseline using rendered monetized impressions divided by eligible requests and supporting evidence from eligible requests, matched requests, rendered impressions, net ecpm and latency.
The central risk is maximizing fill with low-value demand that reduces page quality or blocks better opportunities. A controlled design prevents that failure by separating gross delivery from collected value. It also records what changed, when it changed and which template, demand path or audience cohort received the change. This makes the next decision reproducible instead of dependent on an account-wide average.
Build fill rate ad network around six controllable layers
Each layer connects revenue with a specific implementation and a visible guardrail.
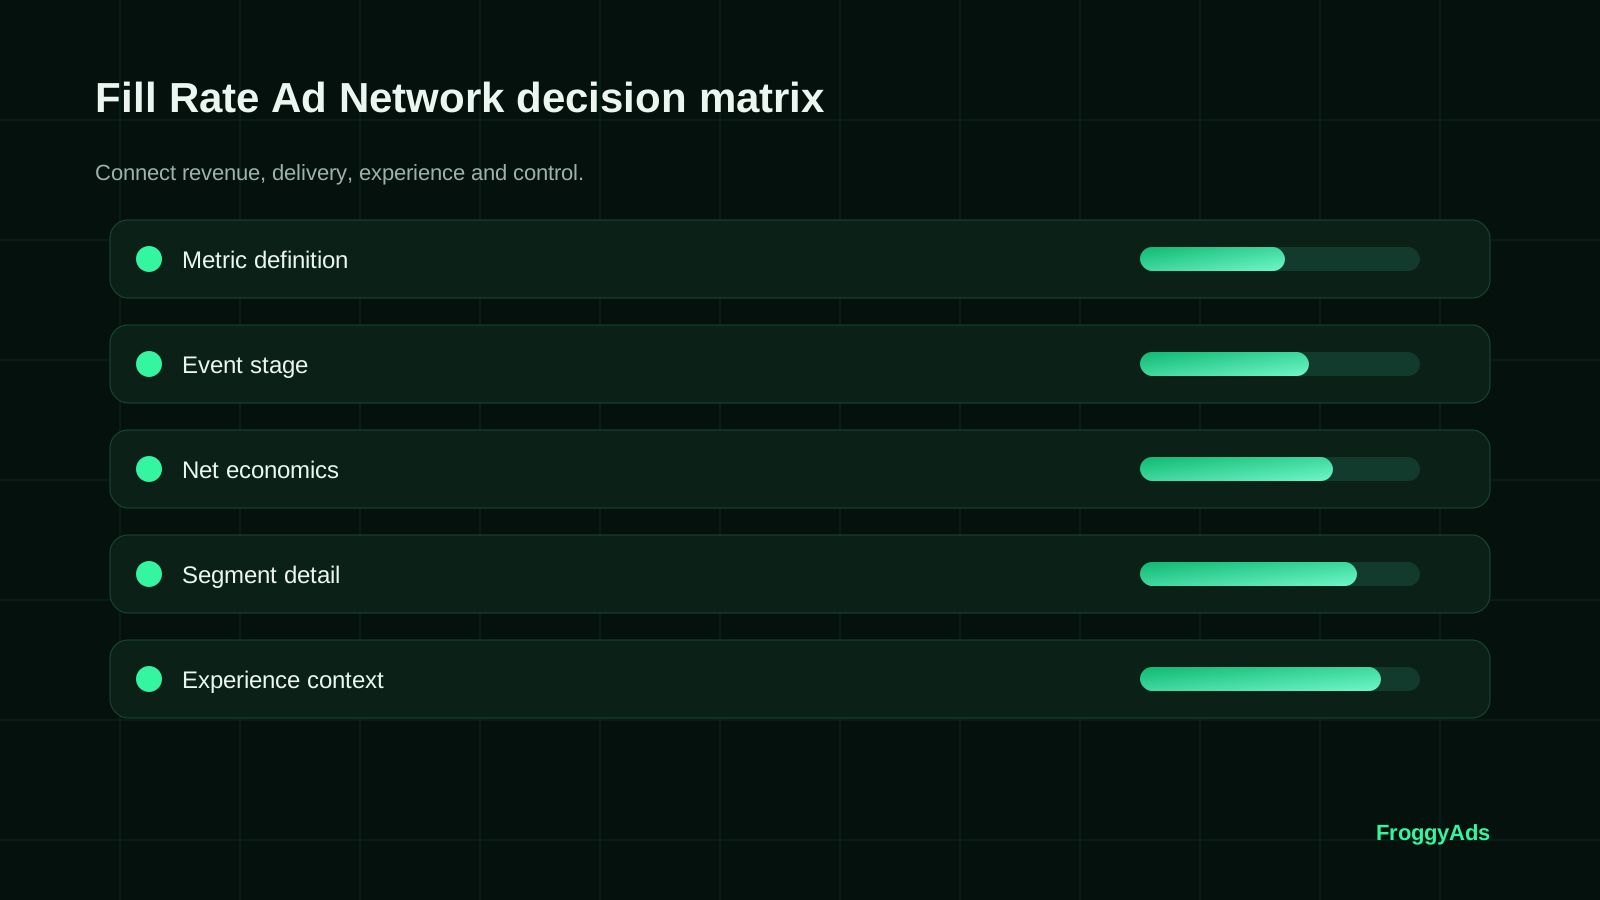
Metric definition
Write the numerator, denominator, revenue basis and time zone. For fill rate ad network, connect this control to rendered monetized impressions divided by eligible requests.
Event stage
Separate requested, matched, served, rendered, measurable and viewable events. For fill rate ad network, connect this control to rendered monetized impressions divided by eligible requests.
Net economics
Remove fees, discrepancies, clawbacks and uncollected revenue. For fill rate ad network, connect this control to rendered monetized impressions divided by eligible requests.
Segment detail
Break results by placement, device, geography and source. For fill rate ad network, connect this control to rendered monetized impressions divided by eligible requests.
Experience context
Read the metric beside latency, layout stability and user behavior. For fill rate ad network, connect this control to rendered monetized impressions divided by eligible requests.
Decision rule
Define which metric change justifies a test, hold or rollback. For fill rate ad network, connect this control to rendered monetized impressions divided by eligible requests.
A seven-step fill rate ad network process
Use a bounded sequence so the first test produces evidence instead of an irreversible sitewide change.
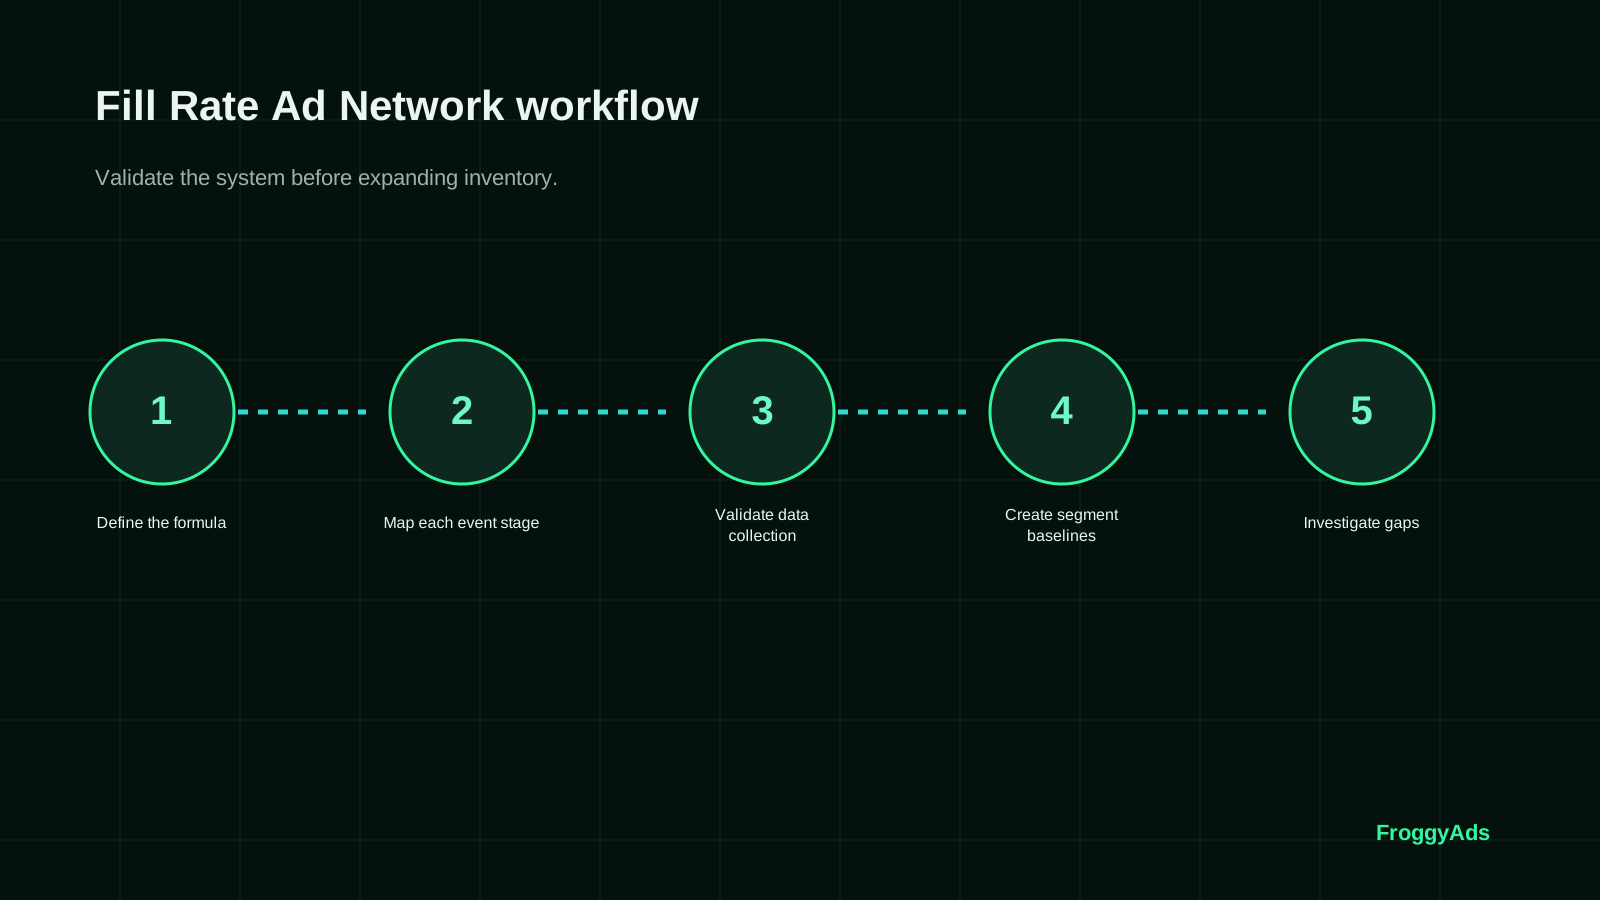
Define the formula
Define the formula for fill rate ad network by keeping placement, geography, device, format and demand partner visible and recording how the change affects eligible requests, matched requests, rendered impressions, net ecpm and latency.
Map each event stage
Map each event stage for fill rate ad network by keeping placement, geography, device, format and demand partner visible and recording how the change affects eligible requests, matched requests, rendered impressions, net ecpm and latency.
Validate data collection
Validate data collection for fill rate ad network by keeping placement, geography, device, format and demand partner visible and recording how the change affects eligible requests, matched requests, rendered impressions, net ecpm and latency.
Create segment baselines
Create segment baselines for fill rate ad network by keeping placement, geography, device, format and demand partner visible and recording how the change affects eligible requests, matched requests, rendered impressions, net ecpm and latency.
Investigate gaps
Investigate gaps for fill rate ad network by keeping placement, geography, device, format and demand partner visible and recording how the change affects eligible requests, matched requests, rendered impressions, net ecpm and latency.
Test one improvement
Test one improvement for fill rate ad network by keeping placement, geography, device, format and demand partner visible and recording how the change affects eligible requests, matched requests, rendered impressions, net ecpm and latency.
Lock the reporting rule
Lock the reporting rule for fill rate ad network by keeping placement, geography, device, format and demand partner visible and recording how the change affects eligible requests, matched requests, rendered impressions, net ecpm and latency.
Measure net value, not a headline rate
The headline decision metric for fill rate ad network is rendered monetized impressions divided by eligible requests. Define the numerator, denominator, currency, time zone and revenue basis before comparing periods. Gross estimates, net reports and collected payments answer different questions. Use one as the decision metric and keep the others as reconciliation layers.
Report the result by placement, geography, device, format and demand partner. The split is not administrative detail. It reveals whether the apparent improvement came from better demand, a different audience, a more viewable placement or a temporary traffic mix. For fill rate ad network, combine the economic metric with eligible requests, matched requests, rendered impressions, net ecpm and latency so a short-term rate increase does not hide a weaker user or advertiser outcome.
Use a maturity window. Some revenue reports, invalid-traffic adjustments, conversions and payments settle after the impression or click. Mark recent periods as provisional and compare them only after the same delay. If the reporting definition changes, start a new baseline rather than blending incompatible data into the fill rate ad network trend.
| Layer | Evidence | Guardrail | Decision |
|---|---|---|---|
| Eligibility | Requests or opportunities that can legally and technically be monetized | Consent, policy and placement rules | Confirm the denominator |
| Demand | Bids, matches, prices and seller paths | Floors, timeouts and partner rules | Keep or remove demand |
| Delivery | Rendered, measurable and viewable events | Speed, layout and frequency | Improve implementation |
| Value | Eligible requests, matched requests, rendered impressions, net eCPM and latency | Rendered monetized impressions divided by eligible requests | Scale, hold or roll back |
Connect supply, demand, delivery and billing
A resilient fill rate ad network setup separates eligibility, auction or demand choice, delivery, rendering and billing. Each layer can fail independently. An eligible opportunity may receive no bid, a winning creative may fail to render, a rendered ad may not be measurable, and reported revenue may later be adjusted. Mapping those stages prevents the team from blaming the wrong component.
Create a small number of inventory classes. Premium, standard, experimental and fallback groups are usually easier to operate than dozens of undocumented exceptions. Give each class a purpose, allowed formats, demand rules, floor or price logic, timeout, frequency and user-experience guardrail. Then evaluate fill rate ad network within the class rather than across a blended site average.
The operating plan should also define ownership. Editorial, product, engineering, ad operations, finance and privacy teams can each influence the result. Assign one owner for the fill rate ad network metric, one owner for technical delivery and one owner for the audience guardrails. Decisions move faster when each team knows which evidence it must provide.
Use the model in three common situations
The right action depends on the current constraint, not on a universal monetization formula.
Metric rises, revenue falls
Verify the denominator and whether net collected revenue changed. In this fill rate ad network decision, use rendered monetized impressions divided by eligible requests as the economic check.
Fill rises, viewability falls
Inspect placement and fallback demand before celebrating delivery. In this fill rate ad network decision, use rendered monetized impressions divided by eligible requests as the economic check.
RPM rises, retention falls
Calculate the value lost from fewer future sessions. In this fill rate ad network decision, use rendered monetized impressions divided by eligible requests as the economic check.
Protect the audience and advertiser value
User experience is part of the revenue equation. A placement that shifts content, delays interaction, obscures navigation or creates repeated interruptions can reduce session depth and future visits. Measure those effects alongside rendered monetized impressions divided by eligible requests. The goal is not the fewest ads or the most ads. It is the highest sustainable value from eligible opportunities.
Advertiser value matters too. Clear labeling, accurate placement descriptions, transparent supply paths and source-level reporting make inventory easier to evaluate. For fill rate ad network, avoid promising guaranteed quality, guaranteed fill or guaranteed revenue. Traffic-quality and supply controls reduce risk, but they do not eliminate every invalid event or market change.
When a change works, scale one lever at a time. Increase eligible inventory, add a demand path, adjust a floor, change a format or expand an audience cohort, but do not do all of them together. Preserve the previous stable version so the team can roll back if the newest fill rate ad network expansion weakens collected revenue or audience behavior.
Five mistakes that weaken fill rate ad network
Use these checks before expanding demand, placements or inventory.
Optimizing a headline metric before the placement, geography, device, format and demand partner breakdown is stable
Changing demand, placement and pricing at the same time during a fill rate ad network test
Ignoring fees, discrepancies, latency or uncollected revenue when calculating rendered monetized impressions divided by eligible requests
Treating user experience as a soft preference instead of an input to future inventory value
Scaling fill rate ad network before the latest traffic period and revenue events have matured
Standards and first-party documentation
These sources define technical concepts and user-experience principles. Your own reporting remains the source of truth for performance.
Fill Rate Ad Network FAQ
Practical answers for publishers, site owners, ad operations teams and media buyers.
What does ad-network fill rate measure?
Fill rate compares eligible ad requests with requests that receive an advertisement under the network's stated counting rules.
Why can two fill-rate reports disagree?
Differences in eligible requests, timezones, blocked traffic, refreshes and failed renders can change each denominator.
Does a higher fill rate always improve publisher revenue?
No. Net rates, viewability, user experience, invalid adjustments and payment terms also determine actual earnings.
Which dimensions should publishers use to inspect fill?
Break results down by country, device, browser, format, placement and time so weak inventory does not hide.
How can floor prices affect fill rate?
A higher floor may reject more bids, while a lower floor can fill impressions at prices the publisher dislikes.
What technical failures reduce reported fill?
Timeouts, blocked scripts, consent errors, unsupported sizes and rendering failures can prevent an available ad from appearing.
Which network data supports an independent check?
Publishers need request, response, render, eligible-impression and revenue records with clear metric definitions.
How should passback or fallback demand be tested?
Verify the full chain under empty, slow and error conditions without creating duplicate requests or disruptive page movement.
When is low fill acceptable?
Lower fill can be reasonable when strict quality, category or price controls protect users and long-term inventory value.
How can a publisher improve fill responsibly?
Fix technical losses first, then test one demand or pricing change while monitoring net revenue and page experience.
Continue the publisher revenue workflow
Use the related guides to connect strategy, measurement, infrastructure and format decisions.
Direct answer: fill rate ad network
Ad-network fill rate is the share of eligible ad requests that receive a matched or served ad under the chosen definition. A useful evaluation combines fill rate with eCPM, request RPM, latency, viewability and net revenue rather than pursuing fill in isolation.
Closely related variants reinforce one resource instead of competing with separate pages.
Keyword ownership
- fill rate ad network
Decision boundary
Evidence event: a declared request, impression, page-view and revenue denominator.
Decision: whether the metric change increases mature net revenue under the same denominator.
Primary risk: mixing denominators, ignoring fill or viewability, or optimizing a rate while total value falls.
| Layer | Evidence to preserve | Action rule |
|---|---|---|
| Eligibility | Placement, source, device, GEO, consent state, creative and commercial terms that determine whether the event may occur. | Do not compare results until the eligibility rule and denominator are the same. |
| Delivery | Requests, matched events, served impressions, clicks, subscriptions, installs or sessions with timestamps and stable IDs. | Separate delivery loss from value loss before changing bids, placements or demand. |
| Business value | Accepted revenue, activation, retention, refunds, invalid activity, operational cost and repeat behavior. | Optimize the mature net outcome rather than the earliest or cheapest event. |
| Change control | Baseline settings, hypothesis, test window, loss ceiling, stop rule and rollback state. | Change one material variable at a time and restore the stable state when the stop rule is reached. |
Operating checklist
- Declare the numerator and denominator before reporting a rate.
- Preserve source and placement identifiers through the complete path.
- Measure page speed, user experience and downstream quality together.
- Wait for delayed revenue and adjustments to mature.
- Document the scale, limit, investigate or stop decision.
Primary documentation
Use transparent supply understanding to plan better campaigns
FroggyAds gives advertisers self-serve access to Push, Native, Display, Pop, Video and Interstitial formats. Inventory, auction conditions and results vary, so launch a measured campaign and optimize by source and accepted outcomes.
Fill Rate Ad Network: Measure Demand Without Hiding Value: what should the advertiser decide next?
For Fill Rate Ad Network: Measure Demand Without Hiding Value, the commercial task is to turn fill rate ad network into one measurable campaign decision. Use What does this page explain about Fill Rate Ad Network: Measure Demand Without Hiding Value? to define the audience or problem, use What fill rate ad network should accomplish to constrain the test, and decide in advance which accepted result would justify more FroggyAds spend.
On this Fill Rate Ad Network: Measure Demand Without Hiding Value page, the decision should remain tied to the existing evidence around What does this page explain about Fill Rate Ad Network: Measure Demand Without Hiding Value?, What fill rate ad network should accomplish and Build fill rate ad network around six controllable layers. Those sections give fill rate ad network its specific context; the table below turns that context into campaign actions rather than adding another generic definition.
| Decision | What to verify | FroggyAds action |
|---|---|---|
| Fill Rate Ad Network: Measure Demand Without Hiding Value objective | Use What does this page explain about Fill Rate Ad Network: Measure Demand Without Hiding Value? to define the accepted business event and the maximum learning loss for fill rate ad network. | Launch one FroggyAds campaign objective for Fill Rate Ad Network: Measure Demand Without Hiding Value and keep the conversion definition stable. |
| Fill Rate Ad Network: Measure Demand Without Hiding Value audience | Use What fill rate ad network should accomplish to verify market, device, language and offer eligibility for fill rate ad network. | Apply only the FroggyAds targeting controls that change the real Fill Rate Ad Network: Measure Demand Without Hiding Value customer journey. |
| Fill Rate Ad Network: Measure Demand Without Hiding Value source evidence | Use Build fill rate ad network around six controllable layers to keep source-level differences visible instead of relying on one blended fill rate ad network average. | Keep, cap, exclude or retest Fill Rate Ad Network: Measure Demand Without Hiding Value inventory from documented source evidence. |
| Fill Rate Ad Network: Measure Demand Without Hiding Value economics | Use Metric definition to connect media spend with accepted conversions and downstream value for fill rate ad network. | Protect the Fill Rate Ad Network: Measure Demand Without Hiding Value test with a written budget boundary and a consistent attribution window. |
| Fill Rate Ad Network: Measure Demand Without Hiding Value scale rule | Use Event stage to define the exact evidence that earns the next budget increase for fill rate ad network. | Scale Fill Rate Ad Network: Measure Demand Without Hiding Value one major control at a time and compare marginal performance with the prior baseline. |
A page-specific FroggyAds test sequence for Fill Rate Ad Network: Measure Demand Without Hiding Value
- Fill Rate Ad Network: Measure Demand Without Hiding Value outcome: define the accepted event for fill rate ad network and the maximum loss permitted while the first test is learning.
- Fill Rate Ad Network: Measure Demand Without Hiding Value path: verify market eligibility, device experience, landing-page continuity and tracking against What does this page explain about Fill Rate Ad Network: Measure Demand Without Hiding Value? before buying more traffic.
- Fill Rate Ad Network: Measure Demand Without Hiding Value hypothesis: launch one bounded FroggyAds test tied to What fill rate ad network should accomplish; do not change bid, creative, audience and destination together.
- Fill Rate Ad Network: Measure Demand Without Hiding Value source review: compare qualified activity, accepted conversions, timing and cost by the source or segment dimensions relevant to Build fill rate ad network around six controllable layers.
- Fill Rate Ad Network: Measure Demand Without Hiding Value scaling: use Metric definition and Event stage to define what must reproduce before the next budget increase.
Why FroggyAds is relevant to Fill Rate Ad Network: Measure Demand Without Hiding Value
For Fill Rate Ad Network: Measure Demand Without Hiding Value, FroggyAds gives advertisers a self-serve DSP and ad-network workflow for buying supported traffic with campaign-level budgets and targeting. Depending on format and campaign context, available controls can include country, city, device, operating system, browser, carrier, category, source, ID and IP options. SmartCPC and Adscore-supported traffic-quality controls can support the fill rate ad network optimization process, while the advertiser's tracker, analytics and backend acceptance remain the final evidence for commercial quality.
Use Event stage as the final checkpoint for Fill Rate Ad Network: Measure Demand Without Hiding Value. If the accepted result does not reproduce after the next meaningful volume step, return to the last stable configuration instead of widening several controls at once.
Fill Rate Ad Network: Measure Demand Without Hiding Value: the publisher decision this URL owns
Use this page when a publisher or supply-side operator needs to evaluate Fill Rate Ad Network: Measure Demand Without Hiding Value from the inventory side. The decision is whether the placement or format can be implemented with clear labeling, acceptable user experience, usable reporting and sustainable monetization. This is a publisher-side reference; FroggyAds advertiser campaign signup is a separate workflow.
URL boundary: This URL owns the publisher decision for Fill Rate Ad Network: Measure Demand Without Hiding Value. Keep it separate from 100 Percent Fill Rate Ad Network and the next publisher-side topic: those pages may share format vocabulary, but each should retain its own implementation, inventory and monetization question.
Publisher decision inputs: Publisher decision inputs: placement implementation, ad labeling, user experience, demand quality, reporting, sustainable monetization. Use them as evidence fields, not promises of fill, revenue or advertiser demand. A useful conclusion should identify what the publisher can verify, what remains unknown and which implementation or inventory action follows. For Fill Rate Ad Network: Measure Demand Without Hiding Value, keep placement implementation, labeling and user experience distinct from demand quality, reporting and sustainable monetization when the page is reviewed.
Publisher evidence path: For Fill Rate Ad Network: Measure Demand Without Hiding Value, the question “What does ad-network fill rate measure?†makes placement implementation, labeling and user experience the opening publisher checkpoint. Use “What fill rate ad network should accomplish†to record what is implemented, what can be observed and what condition would require a rollback or different placement.
Publisher evidence path: Before acting on “Does a higher fill rate always improve publisher revenue?â€, use “A seven-step fill rate ad network process†to document the publisher-side conclusion. The useful output is a named implementation, inventory or monetization action plus the evidence window used to reach it.
Publisher evidence path: “Why can two fill-rate reports disagree?†belongs to the evidence path under “Build fill rate ad network around six controllable layersâ€. Keep demand quality, reporting and sustainable monetization together with the relevant inventory or placement identifier so the publisher can separate a delivery change from a user-experience or monetization change.
| Publisher checkpoint | How to use it | Evidence to retain |
|---|---|---|
| What fill rate ad network should accomplish | Use this section to answer “What does ad-network fill rate measure?” from the publisher perspective. | Retain placement, labeling and implementation evidence relevant to Fill Rate Ad Network: Measure Demand Without Hiding Value. |
| Build fill rate ad network around six controllable layers | Use this section to resolve “Why can two fill-rate reports disagree?” without mixing it with advertiser campaign performance. | Retain reporting, demand-quality and user-experience evidence. |
| Connect Fill Rate Ad Network to a controlled audience test | Use this section to answer “Does a higher fill rate always improve publisher revenue?” before changing inventory or monetization setup. | Document the publisher action, evidence window and rollback or review condition. |
Where FroggyAds fits
FroggyAds primarily serves advertisers buying traffic through our self-serve platform. This publisher-side page explains the inventory and implementation questions behind Fill Rate Ad Network: Measure Demand Without Hiding Value without implying a publisher signup, fill-rate, revenue or demand guarantee. Advertisers can continue to FroggyAds advertiser resources.
Fill Rate Ad Network: Measure Demand Without Hiding Value — what matters first
Fill Rate Ad Network: Measure Demand Without Hiding Value is most useful when it helps a buyer decide whether this option fits the buyer's acquisition workflow. Define the accepted outcome first, then use targeting, budget and source-level evidence to decide what deserves more spend.