
100 Percent Fill Rate Ad Network: What the Claim Misses
Prepared by FroggyAds for advertisers comparing fill claims and inventory economics. Updated: 2026-10-17.
A 100 percent fill rate means every request in a defined report received the response it counts as filled. We explain how to separate paid demand from fallback coverage, verify delivery and decide whether extra fill earns more.

A citable boundary for evaluating complete fill
Separate paid demand, house ads, defaults and passbacks before comparing fill. Then check whether the selected responses rendered and earned revenue. Google's Active View documentation explains viewability; its eCPM reference distinguishes revenue metrics by their denominators. The latter describes historical Ad Exchange reporting, so confirm current field names in your own report. Neither source verifies a network's complete-fill claim. Use your own placement records to judge the additional paid revenue, delivery quality and audience impact.
What must be proved before a network is described as delivering 100 percent fill?
Direct answer: A 100 percent claim is meaningful only with a stated formula. For request-based reporting, fill rate = filled requests / eligible ad requests x 100. Define whether filled means a paid response, any response or a rendered ad. Keep geography, placement, format and time window consistent. House ads can make every slot look occupied while paid fill remains lower. Compare revenue and delivery quality separately before buying or adding demand.
| Measure | Definition and use |
|---|---|
| Paid request fill | Requests receiving a paid response divided by eligible requests, multiplied by 100. Name the network or demand paths included. |
| Total response coverage | Requests receiving any counted response, including house or fallback ads, divided by the same eligible requests. This does not establish payment or rendering. |
| Revenue per 1,000 requests | Revenue divided by eligible requests, multiplied by 1,000. State whether revenue is estimated or finalized and which costs have already been deducted. |
For the separate question of whether an impression had an opportunity to be seen, use Google Active View overview Viewability measurement.
Treat complete fill as an auditable assertion
Define eligible ad requests by placement, format, consent condition, device, geography and page state. Record exclusions separately. Two reports with the same percentage are not comparable if one excludes requests that the other counts. Save the eligibility rule with each result so the denominator can be reproduced.
Give each request a response class: paid winner, house ad, default, passback or blank. A passback may earn revenue downstream, but it is not direct paid demand from the original network. Record the demand path and revenue owner to avoid crediting two partners for the same filled opportunity.
Connect the selected response to browser delivery and billing records. Rendering can fail after a winner is selected; payment can change after an estimate is reported. Separate these stages to determine whether the issue is missing demand, technical delivery or an adjustment to payable revenue.
Six records needed to examine a complete-fill report
These records let operations, engineering and finance discuss the same event without collapsing unlike states.
Eligibility register
List the opportunities allowed into measurement and the reasons any request was blocked or suppressed before demand could answer.
Response taxonomy
Give every returned outcome one unambiguous class, including paid winner, house response, default, passback, no bid and timeout.
Render trace
Link the selected response with browser evidence showing whether the creative loaded, became measurable and had an opportunity to be seen.
Revenue reconciliation
Match payable amounts and later adjustments to the same request cohort instead of treating an auction estimate as collected publisher income.
Audience guardrail
Store latency, layout movement, interruption signals and viewability beside coverage so an extra response cannot hide a damaged session.
Exception queue
Route unmatched events and denominator disputes to named owners, recording resolution evidence before the percentage is republished.
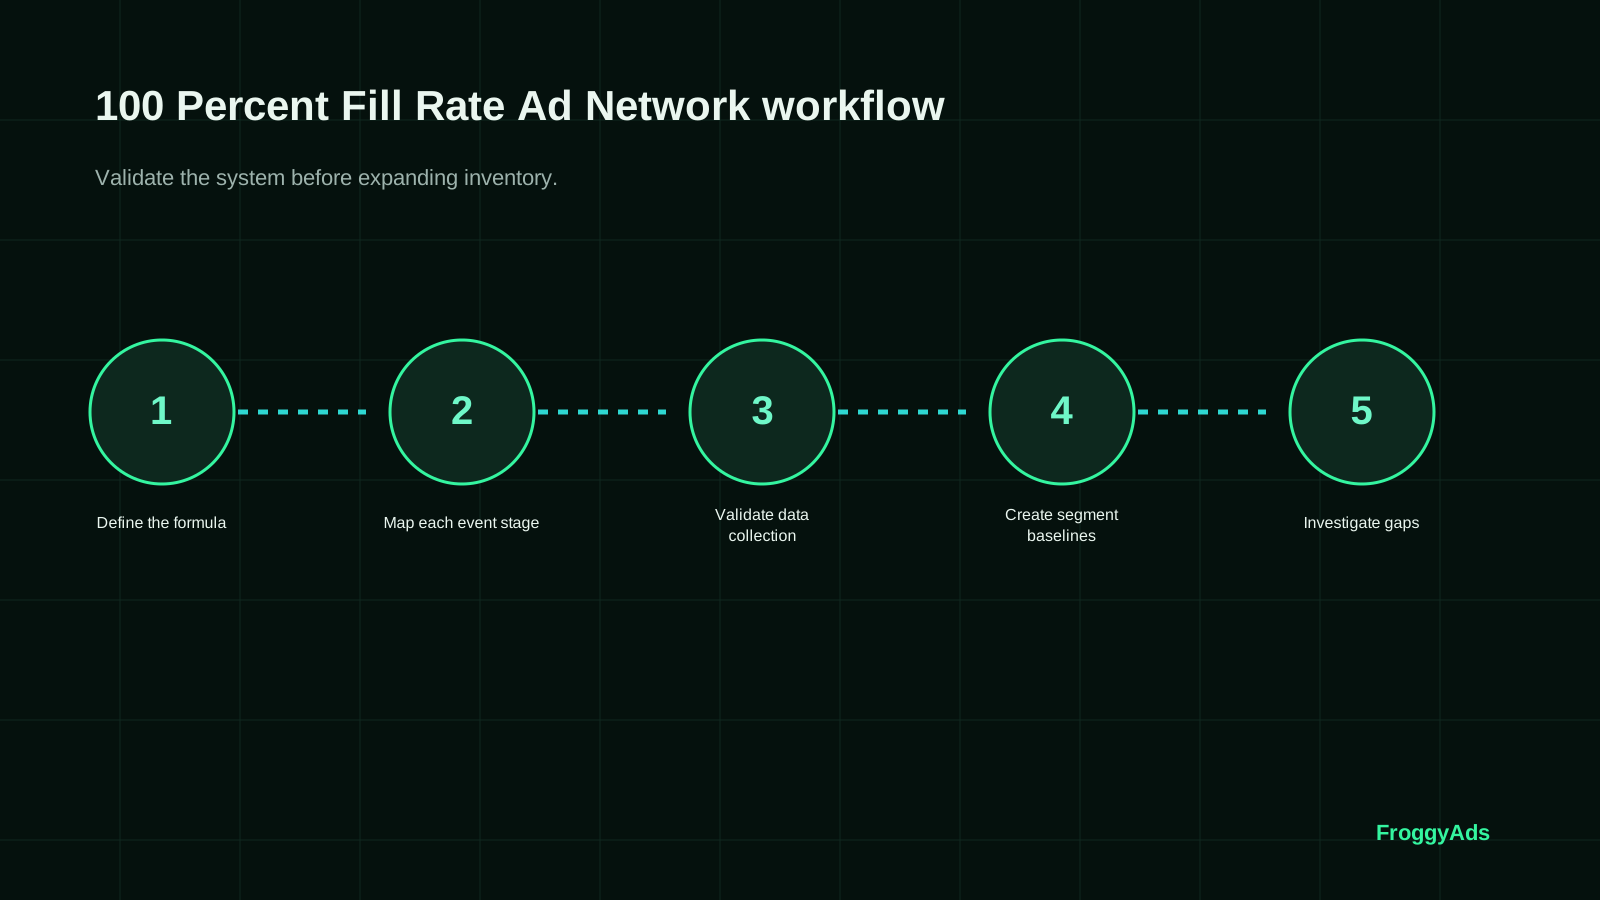
Build the request ledger before optimizing coverage
A bounded ledger turns an attractive percentage into a sequence that can be checked, reproduced and challenged.
Declare eligible inventory
Freeze the placement set, supported sizes, consent conditions and suppression rules. The denominator changes whenever this eligibility definition changes.
Issue a request identity
Assign or preserve a stable request key with timestamp, page context, device and placement so downstream states can return to one opportunity.
Record every demand response
Capture no bid, timeout, paid bid, default, house response and passback distinctly, including which demand path supplied the answer.
Confirm browser delivery
Verify that the chosen creative rendered in the intended slot. Keep selection, render, measurable state and viewable state as separate evidence.
Separate paid and non-paid coverage
Calculate direct paid fill independently from total visual coverage. Name the treatment of internal promotions and downstream sellers in the report.
Reconcile payable revenue
Attach fees, discrepancies, invalid-activity adjustments and payment maturity to the cohort before judging whether extra coverage added retained value.
Publish limits with the result
State the request scope, response classes, observation period and unresolved gaps whenever the claimed percentage is shown to decision makers.
Calculate marginal value for the requests that gain coverage
Illustrative example, not a FroggyAds result: a publisher records 100,000 eligible requests, 90,000 paid responses and 10,000 house responses. Paid request fill is 90%; total response coverage is 100%. Assume those paid responses all render and earn $90 after partner deductions. Net revenue is $0.90 per 1,000 eligible requests, while net eCPM on the 90,000 paid impressions is $1.00. Both calculations describe the same revenue; their denominators answer different questions. House coverage adds no direct paid revenue in this example.
Now assume 8,000 house responses become paid impressions and earn another $4 after the same deductions. Paid fill rises to 98%, total coverage stays at 100%, and net revenue per 1,000 eligible requests rises to $0.94. Paid-impression eCPM falls to about $0.96 because the new impressions earn less. Lower eCPM can therefore accompany higher total revenue. Check whether the extra $4 also covers any costs excluded from the revenue figure. Do not subtract a partner fee twice.
This arithmetic does not prove that a real configuration change caused a revenue increase. Compare compatible placements, traffic mixes and observation windows, preferably with a controlled split. Check latency, rendering, viewability and audience impact alongside the added revenue. If randomization or request-level reconciliation is unavailable, state that limit. A useful decision may be to keep some placements blank rather than accept unsuitable demand, even when the additional responses could raise paid fill.
| Ledger state | Minimum proof | Question answered | Permitted action |
|---|---|---|---|
| Eligible request | Placement, format, consent state and suppression rule | Was this opportunity allowed to seek demand? | Include or exclude with a reason |
| Returned response | Demand path, response class, price and timeout evidence | What answered the opportunity? | Credit the correct response owner |
| Browser outcome | Render, measurable and viewable observations with timing | Did the selected response become useful delivery? | Repair, retain or suppress the path |
| Payable result | Net amount after fees and later account adjustments | Did marginal coverage add retained publisher value? | Expand, cap or reverse the test |
Diagnose the last unfilled requests by failure class
First determine whether the opportunity qualified for monetisation. Consent, policy, format or placement rules may exclude it before any demand is requested. An eligible request may receive no acceptable response; a selected creative may also fail to render. Identify the failed stage before testing another partner or fallback.
Auction and integration evidence should be read together. A no-bid can reflect the market available to that request, while a timeout or malformed response points to delivery engineering. Missing size compatibility, blocked network calls and page lifecycle timing can also appear as low fill. Preserve browser and ad-server observations for the same request keys, then repair the dominant cause in a limited placement cohort.
Not every blank deserves monetization. A publisher may reserve a placement for suitable demand, avoid an intrusive format or suppress an ad under its consent rules. Apply the eligibility rule declared before the test. If an eligible request returns no acceptable ad, keep it in the denominator and record the blank; do not recode it as an exclusion simply to raise fill.
Three outcomes that require different responses
The request ledger determines which team acts and which evidence must change before another test.
Paid fill rises but payable value does not
Review low-value demand, fees and adjustment maturity. Keep the percentage as observed, but return allocation when the marginal cohort contributes no retained revenue.
Total coverage rises through defaults
Report the visual coverage separately and identify house or passback ownership. Do not attribute non-paid responses to the reviewed network's direct paid supply.
Demand answers but rendering fails
Send the affected requests to implementation review with timeout, creative and browser evidence. Establish whether the failure is specific to that demand path or shared by the page before testing another source.
Set quality limits before pursuing the final percentage points
A publisher can increase coverage by accepting more formats, lowering commercial thresholds or adding fallback paths. Each choice changes more than the fill numerator. Measure the resulting request latency, rendering behaviour, viewability and page interaction for the exact placements that changed. Keep mobile and desktop evidence separate when their layout or network conditions differ.
Suitability remains a release condition. Classify which advertiser categories, creative behaviours and landing experiences are allowed for each inventory group. Preserve seller-path and source reporting where available so a problematic response can be traced and removed. A complete response rate is not a reason to accept inventory that conflicts with the publisher's audience or policy boundary.
Save the previous demand configuration, timeout, floor and fallback order before each change. Define when to restore it, using the same revenue and audience limits as the test. Change one factor at a time so a higher fill rate cannot hide the cause of slower delivery or lower revenue.
Five reasons to reject a complete-fill conclusion
Stop the review when the evidence cannot distinguish counting success from commercial or technical success.
The eligible-request denominator is undocumented or changes between the compared periods.
House ads, defaults and passbacks are credited as though they were paid responses from the same network.
Selected responses are counted without confirming render, measurable state or browser timing.
Estimated auction value is presented before fees, discrepancies and payment adjustments have matured.
Coverage expands despite a breached latency, suitability, viewability or audience-experience boundary.
Primary documentation for interpreting the ledger
Use these external definitions to interpret viewability, eCPM, reporting fields and experience standards; only the publisher's own joined records establish the result of its test.
- Google Active View documentationReference for interpreting viewability observations
- Google Ad Manager eCPM documentationReference for checking the value calculation
- Google Ad Manager reporting referenceReference for naming report fields consistently
- Coalition for Better Ads standardsReference for disruptive experience boundaries
100 Percent Fill Rate Ad Network FAQ
Practical answers for publishers, site owners, ad operations teams and media buyers.
What does a 100 percent fill rate actually measure?
A reported 100 percent fill rate needs a named denominator and a named counted event. For request-based reporting, divide filled requests by eligible ad requests and multiply by 100, then state whether a fill is a paid response, any response or a rendered ad. Compare paid yield, viewability and latency separately before treating complete coverage as a commercial advantage.
Does 100 percent fill guarantee maximum publisher revenue?
No. A fully covered placement can include low-value paid demand, house ads, defaults or passbacks. Publishers should compare payable revenue and later adjustments with latency, viewability and audience impact before deciding whether the additional coverage improved retained value.
Which response types should a complete-fill report keep separate?
Record paid winners, house responses, defaults, passbacks, no bids, timeouts and intentional blanks as distinct outcomes. Keeping those classes separate prevents visual coverage from being reported as direct paid demand from the network being evaluated.
How can a publisher verify that a selected ad was delivered?
Link each selected response to browser evidence for the same request. Selection, render, measurable state and viewable state are separate checkpoints, because a winning response can still fail to load in the intended placement.
Why must fill-rate revenue be reconciled after delivery?
Auction estimates are not the same as collected revenue. Match payable amounts, partner fees, discrepancies, invalid-activity deductions and later adjustments to the original request cohort before judging whether broader coverage produced additional publisher value.
What should a request ledger contain for a fill-rate audit?
Use a stable request ID with time, page context, device and placement. Add eligibility, demand response, selected creative, browser delivery, viewability and payable revenue so operations, engineering and finance can reproduce the reported percentage from the same events.
How should the marginal value of added coverage be calculated?
Isolate requests that changed from blank, timeout or non-paid fallback to paid delivery. Calculate the payable revenue added, subtract any fees and adjustments not already deducted, and compare compatible placement and traffic windows.
What can cause the final unfilled requests?
Separate excluded opportunities from unfilled eligible requests. Eligible requests may receive no acceptable bid, time out, return an incompatible creative or fail during rendering. Classify the failed stage before changing demand, and keep exclusions outside the denominator defined for this report.
When can leaving an ad opportunity blank be the right choice?
A blank can be appropriate when demand does not meet consent, policy, suitability, format or value requirements. Complete visual coverage is not beneficial if the final response harms user experience or contributes no retained revenue.
Which evidence supports expanding toward complete fill?
Expand a limited placement cohort only when request-level records show that the newly covered opportunities render correctly, remain measurable and add payable value after costs and adjustments. Keep a rollback point if latency, viewability or audience impact deteriorates.
Continue with the exact metric that failed
Choose the next guide from the unresolved ledger state instead of restarting with another headline percentage.
Decision record for a claimed 100 percent fill rate
A complete-fill claim is usable only when its eligible-request denominator, response classes and observation window are disclosed. Commercial approval requires a separate marginal net-value decision.
Keep this record with the exact placement cohort so the percentage cannot be reused outside the population it describes.
Claim in scope
- 100 percent fill rate ad network
Required verdict
Ledger evidence: eligible request, response class, browser outcome and payable record share one traceable cohort.
Commercial decision: the additional covered requests contribute retained value without crossing a declared quality limit.
Invalid shortcut: a visual percentage, sitewide average or partner promise is used without request-level reconciliation.
| Audit checkpoint | Evidence stored | Release condition |
|---|---|---|
| Scope freeze | Eligible placement population, consent state, format and exclusion reasons | One stable denominator is available for both cohorts |
| Response coding | Paid, house, default, passback, no-bid and timeout outcomes | Every request receives one accountable response class |
| Delivery proof | Selection, render, measurable and viewable observations | Technical loss is separated from absent demand |
| Value close | Payable revenue, adjustments, delivery cost and audience limits | Marginal coverage clears the written net-value boundary |
Close-out sequence
- Freeze the request population before the comparison starts.
- Name every response category included in the displayed rate.
- Join ad-server selection with browser delivery evidence.
- Wait for payable revenue adjustments to close.
- Record why the marginal cohort expands, pauses or rolls back.
Metric references
Turn publisher coverage into an advertiser test
With FroggyAds, select formats and manage sources in one self-serve account. Compare accepted conversions and acquisition cost, then adjust bids or source lists. A publisher fill claim cannot establish your available inventory or forecast sales. Check formats, targeting and tracking before launching a focused test.
How to Evaluate a 100 Percent Fill Rate Ad Network Claim
A search for a 100 percent fill rate ad network often comes from publishers or media buyers who want dependable delivery, but a perfect fill-rate promise is not the same as profitable, policy-safe, or high-quality traffic. The practical question is whether available demand matches the page, GEO, device mix, floor price, ad format, and brand-safety requirements. A network can technically return an ad for nearly every eligible request while still producing weak revenue or poor advertiser outcomes if pricing, viewability, source transparency, or audience fit is ignored.
For teams comparing ad networks with high fill rates, examine fill rate together with eCPM, accepted impressions, viewability, invalid-traffic controls, payment terms, reporting depth, and the ability to segment results by placement or source. FroggyAds is built for buyers who want broad global supply with campaign-level controls rather than a single headline metric. That makes it easier to test whether inventory actually supports the conversion, engagement, or reach goal behind the campaign.
What should you ask before choosing a high-fill ad network?
Ask how fill rate is calculated, which requests are excluded, how floor prices affect delivery, whether passbacks or no-bids are counted, and how invalid traffic is filtered. Then compare the answer with your own analytics. For advertisers, the equivalent long-tail question is which ad network offers high availability with source-level optimization. The strongest answer is the platform that lets you see enough detail to separate useful scale from cheap but unproductive volume. FroggyAds gives performance marketers a practical environment for controlled testing across formats, markets, devices, and sources, so the decision can be based on measurable outcomes rather than an absolute fill-rate slogan.
100 Percent Fill Rate Ad Network: What the Claim Misses: the publisher decision this URL owns
Use this page when a publisher or supply-side operator needs to evaluate 100 Percent Fill Rate Ad Network: What the Claim Misses from the inventory side. The decision is whether the placement or format can be implemented with clear labeling, acceptable user experience, usable reporting and sustainable monetization. This is a publisher-side reference; FroggyAds advertiser campaign signup is a separate workflow.
URL boundary: This URL owns the publisher decision for 100 Percent Fill Rate Ad Network: What the Claim Misses. Distinguish it from Fill Rate Ad Network and the next publisher-side topic: those pages may share format vocabulary, but each should retain its own implementation, inventory and monetization question.
Publisher decision inputs: Publisher decision inputs: placement implementation, ad labeling, user experience, demand quality, reporting, sustainable monetization. Use them as evidence fields, not promises of fill, revenue or advertiser demand. A useful conclusion should identify what the publisher can verify, what remains unknown and which implementation or inventory action follows. For 100 Percent Fill Rate Ad Network: What the Claim Misses, keep placement implementation, labeling and user experience distinct from demand quality, reporting and sustainable monetization when the page is reviewed.
Publisher evidence path: For 100 Percent Fill Rate Ad Network: What the Claim Misses, the question “What does a 100 percent fill rate actually measure?†makes placement implementation, labeling and user experience the opening publisher checkpoint. Use “A citable boundary for evaluating complete fill†to record what is implemented, what can be observed and what condition would require a rollback or different placement.
Publisher evidence path: Before acting on “Which response types should a complete-fill report keep separate?â€, use “Six records needed to examine a complete-fill report†to document the publisher-side conclusion. The useful output is a named implementation, inventory or monetization action plus the evidence window used to reach it.
Publisher evidence path: “Does 100 percent fill guarantee maximum publisher revenue?†belongs to the evidence path under “Treat complete fill as an auditable assertionâ€. Keep demand quality, reporting and sustainable monetization together with the relevant inventory or placement identifier so the publisher can separate a delivery change from a user-experience or monetization change.
| Publisher checkpoint | How to use it | Evidence to retain |
|---|---|---|
| Define which requests and outcomes count | Use this section to answer “What does a 100 percent fill rate actually measure?” from the publisher perspective. | Retain placement, labeling and implementation evidence relevant to 100 Percent Fill Rate Ad Network: What the Claim Misses. |
| Audit coverage as a measured claim | Use this section to resolve “Does 100 percent fill guarantee maximum publisher revenue?” without mixing it with advertiser campaign performance. | Retain reporting, demand-quality and user-experience evidence. |
| Keep the six records together for review | Use this section to answer “Which response types should a complete-fill report keep separate?” before changing inventory or monetization setup. | Document the publisher action, evidence window and rollback or review condition. |
Where FroggyAds fits
FroggyAds primarily serves advertisers buying traffic through our self-serve platform. This publisher-side page explains the inventory and implementation questions behind 100 Percent Fill Rate Ad Network: What the Claim Misses without implying a publisher signup, fill-rate, revenue or demand guarantee. Advertisers can continue to FroggyAds advertiser resources.
100 Percent Fill Rate Ad Network: What the Claim Misses — what matters first
100 Percent Fill Rate Ad Network: What the Claim Misses is most useful when it helps a buyer decide whether this option fits the buyer's acquisition workflow. Define the accepted outcome first, then use targeting, budget and source-level evidence to decide what deserves more spend.