
Decision timingMeasure by cohortFollow interactions from a fixed period until their conversions mature. Build a maturity curveShow the share of outcomes captured after one day, three days, seven days and beyond. Time the decisionMatch optimization cadence to the speed of the buying cycle and reporting pipeline.
Use conversion lag analysis before judging recent campaign results
Conversion lag is the time between an advertising interaction and the customer action it leads to. Analyze that delay before judging recent FroggyAds campaign results: a source can look expensive today while purchases or qualified leads are still arriving. Compare traffic groups at a similar age, keep confirmed outcomes separate from forecasts and retain your campaign spending limits.

When are recent campaign results ready to judge?
Quick answer: Compare interaction groups at a similar age, using the conversion event that matters to your business. Keep customer delay separate from reporting delay, label unfinished results and retain spending limits while later outcomes arrive.
| Section | Distinct excerpt from this page |
|---|---|
| Recent performance is a partial observation, not a final result | Three controls help distinguish a true performance change from an ordinary delay in customer action or reporting. |
| Interaction cohort | This prevents late conversions from being mixed into a different acquisition period. |
| Conversion age | Use hours for short funnels and days or weeks for considered purchases. |
Reference for Conversion Lag Analysis for Paid Media: Google Ads: About conversion lag reporting.
Core controls
Recent performance is a partial observation, not a final result
Three controls help distinguish a true performance change from an ordinary delay in customer action or reporting.
Interaction cohort
Group clicks or eligible impressions by the date they occurred. This prevents late conversions from being mixed into a different acquisition period.
Conversion age
Calculate elapsed time from interaction to accepted outcome. Use hours for short funnels and days or weeks for considered purchases.
Maturity threshold
Choose the point at which enough historical conversions have arrived for a given decision, while keeping a later checkpoint for finance and final reporting.
Review criteria
What conversion lag reveals that a daily dashboard hides
A daily dashboard answers what has been reported so far. It does not answer how many outcomes will ultimately belong to the interactions that happened yesterday. When the buying cycle is longer than the reporting cadence, recent CPA looks worse and recent ROAS looks lower because the spend has arrived before all conversions and value have been recorded.
Conversion lag analysis changes the unit of observation. Instead of looking only at conversions by calendar day, it follows a cohort of ad interactions and measures how long those interactions take to produce accepted outcomes. The result is a maturity curve: the cumulative share of final conversions observed after a series of elapsed-time checkpoints.
The curve helps media buyers know when to act. A campaign in which ninety percent of conversions arrive within twenty-four hours can support faster source decisions than a campaign in which half of the outcomes arrive after a week. The correct optimization speed comes from the business cycle, not from a habit of checking the dashboard every morning.
Review criteria
Record the evidence, owner, review window and rollback condition before this step changes live campaign delivery. Keep the original control available until the result is stable enough to repeat.
Decision workflow
Move from signal to action in a controlled sequence
Each step has a clear input, owner and stopping point so campaign changes remain explainable.
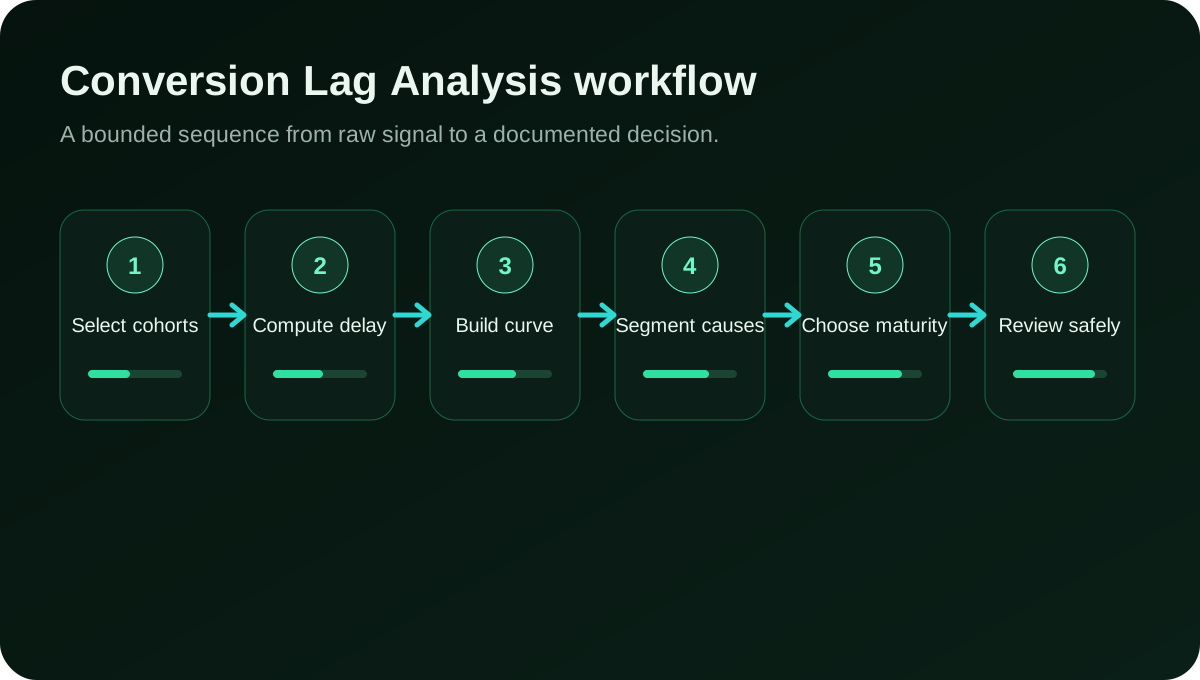
Connect the guide to live testing
Connect Use conversion lag analysis before judging recent campaign to a controlled audience test
Use the choices established in “Move from signal to action in a controlled sequence” to define one audience, budget and source set in FroggyAds. Keep the surrounding offer and measurement rule stable so the test adds evidence to use conversion lag analysis before judging recent campaign instead of mixing several changes at once.
Create My Free Account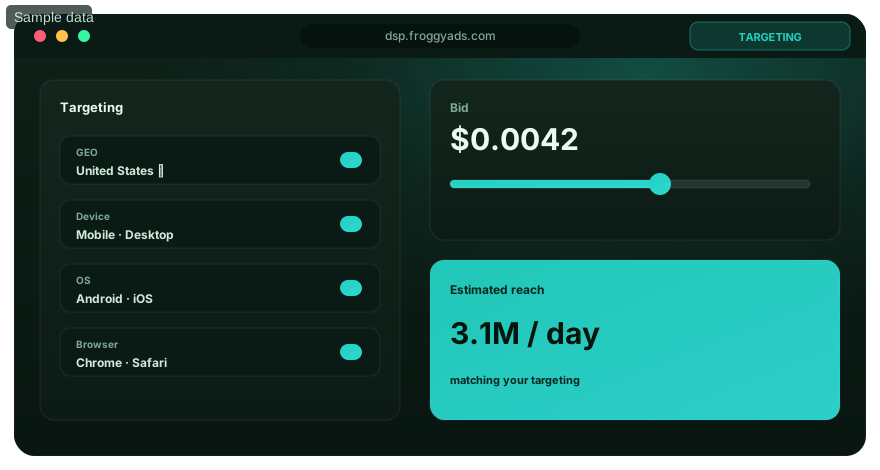
Measurement note
Create the dataset with the right two timestamps
At minimum, each record needs an interaction timestamp and a conversion timestamp tied by a lawful, reliable identifier. The interaction can be a click or another eligible event, depending on the measurement design. The conversion should be the business outcome used for the decision, not an intermediate page view that happens earlier in the funnel.
Normalize both timestamps to one time zone before calculating elapsed time. Preserve the raw values for auditability. If the ad platform reports conversions back to the click date, export or query a view that still exposes conversion time, days-to-conversion or cohort behavior. If only aggregate data is available, build maturity snapshots by saving the same cohort total at repeated intervals.
Exclude or mark records whose event IDs, click IDs or acceptance status are incomplete. Missing identity can make long-lag conversions look like direct or organic outcomes. A clean lag distribution depends on the same identifier continuity required for trustworthy attribution.
Measurement note
Operating rule
Build a maturity curve that buyers can use
Choose checkpoints that match the funnel: same session, one hour, six hours, one day, three days, seven days, fourteen days and thirty days are common starting points. For each checkpoint, calculate the cumulative percentage of the final mature cohort that has converted by that age. Use a sufficiently old cohort as the denominator so the final total is not still moving materially.
Do not rely only on the average delay. A small number of very late conversions can stretch the mean and hide the fact that most outcomes arrive quickly. Report the median, the 75th or 80th percentile and the 90th percentile. The percentile view answers practical questions such as how long it takes to observe eighty percent of the expected conversions.
Repeat the curve by meaningful segment: conversion action, format, GEO, device, weekday, new versus returning customer and source group. Different segments can mature at different speeds. A single blended curve can cause a fast funnel to be reviewed too slowly and a slow funnel to be cut too early.
Operating rule
Choose the execution format
Choose a paid-media format that supports Use conversion lag analysis before judging recent campaign
Use the criteria around “Build a maturity curve that buyers can use” to decide whether push, native, display or pop fits the message and destination. Set format, targeting and spend as campaign controls in FroggyAds while the use conversion lag analysis before judging recent campaign decision remains the standard for judging the result.
Create My Free Account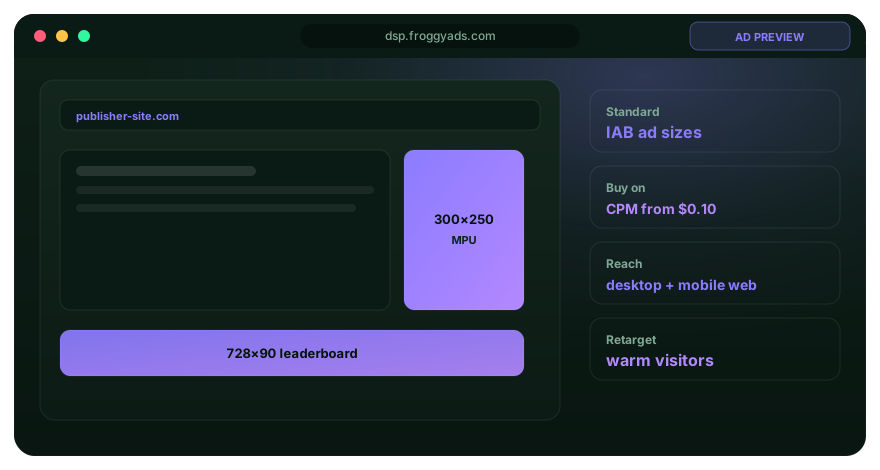
Quality control
Separate customer delay from reporting delay
Conversion lag has at least two components. Customer delay is the time between the ad interaction and the person completing the action. Reporting delay is the time between the business event and the event becoming visible in the system used for decisions. Payment confirmation, CRM qualification, offline imports and analytics processing can add reporting delay after the customer has already converted.
Use backend event time and platform availability time when possible. If the business event happened on Monday but appeared in the advertising report on Wednesday, the campaign has one customer-delay profile and another reporting-freshness profile. Both matter, but the fixes differ. Customer delay changes the decision horizon; reporting delay may be improved through pipeline design or import cadence.
When data is sparse, keep the categories explicit rather than presenting a precise adjustment that the evidence cannot support. A directional maturity band is more honest than a false prediction based on a handful of conversions.
Quality control
Review checkpoint
Turn lag into operating rules
Define at least two reporting states: provisional and mature. Provisional reporting can support monitoring for severe delivery or tracking failures, but it should carry a warning that CPA and ROAS are incomplete. Mature reporting is used for source blocking, budget scaling and performance commitments after the chosen share of outcomes has arrived.
For example, a team may inspect same-day click quality and landing sessions, review creative after three days, make source-level CPA decisions after seven days and close the finance view after thirty days. The exact schedule should come from the observed curve and the cost of waiting versus the cost of a wrong decision.
If the platform offers lag-adjusted forecasts, treat them as estimates and compare them with your own mature cohorts. Preserve unadjusted results beside any modeled projection. Buyers should know which number is observed and which number is expected.
Review checkpoint
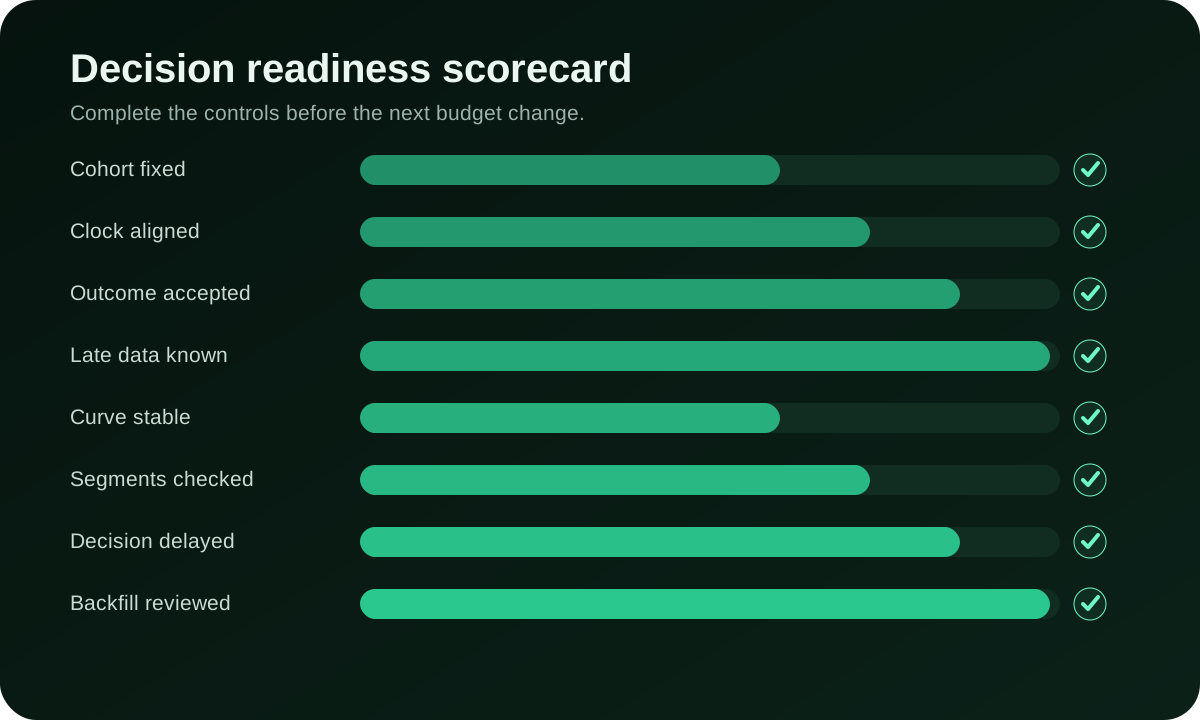
Readiness scorecard
Check the evidence before changing budget or delivery
A complete scorecard does not guarantee the decision is correct, but it reduces avoidable measurement and process errors.
Cohort fixed
Clock aligned
Outcome accepted
Late data known
Curve stable
Segments checked
Decision delayed
Backfill reviewed
Put the guide into practice
Turn Use conversion lag analysis before judging recent campaign into a bounded campaign test
With “Check the evidence before changing budget or delivery” documented, launch only the next reversible test. Set a spending limit, preserve the baseline and use source-level and audience controls so the next step depends on qualified outcomes for use conversion lag analysis before judging recent campaign, not activity volume.
Create My Free Account
Worked scenarios
How the decision changes in real campaign conditions
Use the evidence pattern, not a single metric, to choose the next bounded action.
A new source looks expensive after two days
Historical cohorts show that only forty percent of accepted conversions arrive within forty-eight hours. Keep the source in a controlled budget cell until the seven-day maturity checkpoint. Monitor click quality and event delivery for immediate problems, but do not blacklist the source from provisional CPA alone.
The campaign appears to improve every Monday
Weekend interactions convert later because the business completes verification on weekdays. Segment the lag curve by interaction day and backend processing schedule. The Monday lift may be delayed weekend value rather than a new campaign improvement.
A promotion changes the buying cycle
A limited-time offer produces faster decisions than the normal evergreen funnel. Build a separate cohort curve for the promotion rather than applying the old maturity rule. Return to the evergreen rule after the offer ends and the audience mix normalizes.
Limits
What this method cannot prove by itself
A lag curve describes observed historical behavior. It can change when the offer, price, audience, checkout, season or conversion definition changes. Re-estimate it after material funnel changes.
Lag adjustment cannot repair missing conversions or broken identity. First verify event delivery and acceptance, then interpret the timing distribution.
Rollback rule
Keep the previous control, log the change and define the condition that returns the campaign to the safer state. A useful framework makes reversal as clear as rollout.
Operating record
Turn the lag curve into a campaign decision calendar
A lag curve becomes operational when it tells the media buyer when a result is mature enough for a specific decision. Build separate checkpoints for creative screening, source evaluation, bid changes and budget scaling. A creative may be screened with an early click or landing-page signal, while a source-level CPA decision may need most conversions to mature. The correct checkpoint depends on the consequence of being wrong.
For each checkpoint, record the expected completion share. For example, the team might observe that a meaningful portion of qualified conversions arrives after the first reporting day. The exact share should come from the advertiser's own cohort history, not a generic benchmark. Recalculate it when the offer, GEO, device mix, checkout flow, promotion or conversion definition changes because each can alter customer decision time.
| Decision | Evidence needed | Premature action to avoid |
|---|---|---|
| Creative screening | Stable delivery plus early engagement and quality signals | Pausing after a handful of impressions or clicks |
| Placement review | A mature interaction cohort with enough conversions | Blocking sources while their conversions are still pending |
| Bid adjustment | Mature CPA or value with unchanged tracking | Cutting bids because the newest day is incomplete |
| Budget scaling | Repeated mature cohorts and acceptable downstream quality | Scaling from one unusually fast conversion cohort |
Maintain two views: event date for operations and interaction cohort for evaluation. The event-date view helps finance and support teams understand what happened today. The cohort view shows what traffic acquired on a particular day eventually produced. Comparing both helps distinguish a genuine demand change from a calendar artifact. Add an annotation whenever tracking, pricing or promotions change so a shift in the curve is not mistaken for normal delay.
Review the calendar on a fixed cadence. If the lag distribution is stable, the same rules can be reused. If it moves, investigate whether the change comes from customers, reporting pipelines or traffic composition before adjusting campaign thresholds.
Questions
Use conversion lag analysis before judging recent campaign results: FAQ
Practical answers for advertisers, analysts and media buyers.
What is conversion lag analysis?
Conversion lag analysis measures how long it takes for a recorded ad interaction to be followed by the conversion you track. Group interactions from the same period and follow their later outcomes. This helps you decide when a FroggyAds source comparison is ready to guide spending. It does not predict that every recent click will convert or turn an unfinished cohort into a confirmed result.
How is conversion delay different from reporting delay?
Conversion delay is the customer's time to act after the interaction. Reporting delay is the time between that action and its appearance in a system. Keep separate timestamps when your setup supports them. A purchase made three days after a click is different from a purchase made immediately but reported three days late. The first concerns the buying journey; the second may concern an upload, processing or tracking issue.
Why can yesterday's cost per acquisition look worse than last week's?
Yesterday's traffic has had less time to convert. In a hypothetical cohort, $120 of spend has four confirmed conversions after one day, giving a $30 CPA. If that same cohort reaches twelve confirmed conversions by day seven, its CPA becomes $10 without another dollar of media spend. This illustrates delay, not expected FroggyAds performance. Compare cohorts at similar ages before deciding that a new source is weaker.
How long should I wait before optimizing a campaign?
Use your own conversion-delay pattern, the event you care about and the decision at stake. A quick signup may become interpretable sooner than a qualified sales opportunity. Review technical health and spending limits immediately, but let performance comparisons use complete enough outcomes. Our campaign controls let you limit exposure while waiting; you do not need to leave a test spending without a clear boundary.
What data do I need to build a conversion-lag report?
You need the interaction time, conversion time, event definition and a reliable way to connect the records or their cohorts. Keep time zones consistent and remove duplicate notifications. Add a report cutoff so readers know which outcomes could have arrived. Combine FroggyAds campaign and source information with your accepted conversion records, without inventing an individual match where the available data supports only an aggregate view.
Should I use average delay or a maturity curve?
A curve or a few clearly labelled percentiles usually explains more than one average. For example, show what share of observed conversions arrived within one, three and seven days, together with the cohort size and observation window. A few late conversions can pull the mean upward. Keep the selected window explicit: conversions outside that window are not automatically represented in the curve.
Should I calculate conversion lag separately for every source?
Separate sources, devices, offers or markets when they have a plausible difference and enough data to support the comparison. Very small groups can produce unstable delay estimates. Start with useful campaign-level cohorts, then inspect source differences that could change your buying decision. Our source controls help you act on a confirmed pattern, but a single late conversion is not a reliable scheduling rule for an entire placement.
Can I pause a campaign before its conversions have fully matured?
Yes. A broken destination, missing measurement, unsuitable delivery or a reached spending limit can justify an immediate pause. Waiting for delayed conversions does not mean ignoring those problems. Record why you paused and continue reviewing any legitimate outcomes that arrive from earlier spend. Keep that safety decision separate from a final judgment about the source's conversion rate or acquisition cost.
Why did the conversion-lag pattern change after a promotion?
An offer can change the time people need to decide, and it can also change the audience or source mix. Check the promotion, pricing, follow-up process and event setup before reusing the old curve. Compare sufficiently mature cohorts from before and after the change. A faster signup or a slower high-value sale should not be blended into one unexplained trend.
How should conversion lag affect my next FroggyAds budget increase?
Base the increase on confirmed results from mature enough cohorts and label any estimate for recent traffic separately. Keep a record of the previous bid, budget and source mix, then expand one setting. Our source-level buying controls let you increase the part of the campaign that has earned more spend while retaining a limit on new tests. Delayed outcomes explain uncertainty; they do not guarantee that extra traffic will meet the same CPA.
Continue the workflow
Connect the measurement rule to campaign execution
Use the related FroggyAds resources to move from analysis into a controlled test, tracking review or budget decision.
Run a measured campaign
Turn the framework into a controlled traffic test
Launch with clear tracking, source-level reporting, bounded budgets and a documented optimization plan.
Search intent and buyer decision
Use conversion lag analysis before judging recent campaign results: the decision this URL owns
Use this page to decide when delayed conversions are mature enough for a source or budget decision. Separate reporting delay from true conversion quality so young cohorts are not penalized prematurely. Keep this URL focused on that decision; use Online Marketing Analysis for the adjacent task.
Decision inputs for Use conversion lag analysis before judging recent campaign results: campaign objective, audience targeting, source quality. On this URL, use those inputs to understand the concept and apply it to a concrete campaign decision and keep each one tied to the same accepted-event definition.
Page-specific evidence path: Use the visible sections Use conversion lag analysis before judging recent campaign results as evidence for Use conversion lag analysis before judging recent campaign results. They should answer the page's own buying question before budget is increased; they are not interchangeable with the neighboring URL or with a generic traffic checklist.
| Checkpoint | Page-specific action | Evidence to retain |
|---|---|---|
| Lag window | Measure how long accepted conversions take to appear. | Event timestamps and cohort age. |
| Decision cutoff | Define when a cohort is mature enough to compare. | Maturity threshold and pending share. |
| Optimization | Change bids or sources only after comparable cohorts reach the cutoff. | Mature CPA/value and source action. |
Transparent decision example
Hypothetical example: For Use conversion lag analysis before judging recent campaign results, if a controlled test spends USD 150 and records 8 accepted outcomes after the same review window, accepted cost is USD 18.75 per outcome. Replace the inputs with your own economics and the event definition appropriate to this page.
Why use FroggyAds for this step?
For Use conversion lag analysis before judging recent campaign results, use FroggyAds as the paid-media side of the measurement chain: preserve source identifiers and conversion evidence while the advertiser-side system remains authoritative for the accepted event. Create your free FroggyAds account.
Conversion Lag Analysis worked application example
Hypothetical example: a buyer using this Conversion Lag Analysis guide can turn one recommendation into a test by naming the accepted event, fixing the review window and changing one campaign variable. If USD 175 produces 7 accepted outcomes, the resulting accepted CPA is USD 25.00; use your own numbers and economics before deciding what to change next.
Direct answer
Use conversion lag analysis before judging recent campaign results — what matters first
Use conversion lag analysis before judging recent campaign results is most useful when it helps a buyer understand the concept and apply it to a concrete campaign decision. Define the accepted outcome first, then use targeting, budget and source-level evidence to decide what deserves more spend.