
Measurement reconciliationAlign the clockCompare the same interaction dates, conversion dates, time zones and reporting maturity. Align the rulesMatch counting, attribution, windows, filters and accepted business outcomes. Protect decisionsSeparate harmless reporting differences from gaps that can distort bids, budgets or source controls.
Reconcile conversion tracking discrepancies before changing spend
Different conversion totals can both be valid. Establish whether the gap is explainable and safe for your buying decision. FroggyAds supports S2S postbacks and URL macros for evaluating paid traffic with your own tracker.

How should you investigate a conversion tracking discrepancy?
Quick answer: Align population, clock and accepted event. Trace records, classify differences and test the remainder against a decision tolerance. An acceptable global gap can still conceal broken source identity.
| Section | What to establish first |
|---|---|
| A discrepancy becomes actionable only after the comparison is normalized | Save the exact cohort, extraction time and reference system so every adjustment can be reversed. |
| Comparable populations | Separate accepted, unique business outcomes from other events or attributed estimates. |
| Comparable timing | Compare one cohort with an explicit maturity rule; different reporting dates need a documented bridge. |
Reference for Conversion Tracking Discrepancies Guide: Google Ads: Data discrepancies, factors and troubleshooting.
Core controls
A discrepancy becomes actionable only after the comparison is normalized
Start with three controls that remove the most common false alarms before engineers or media buyers change anything.
Comparable populations
Use the same campaign scope, conversion action, geography, device set and customer status. A dashboard that includes modeled or cross-device results cannot be compared directly with a raw order export.
Comparable timing
Record whether each system reports by click date, impression date, event date or processing date. Extend the observation window so delayed conversions and late data processing can mature.
Comparable acceptance
Define the business event that counts. A thank-you page, payment authorization, paid order, approved lead and retained customer are different outcomes and should not share one label.
Review criteria
Why reporting systems disagree even when tracking works
Advertising platforms, web analytics tools, trackers and CRMs are designed for different jobs. An ad platform usually connects an outcome to an eligible ad interaction and may use modeled or cross-device information. An analytics product often organizes sessions and events around its own identity, consent and channel rules. A CRM records business objects such as leads, opportunities, orders or payments after they pass operational checks. Those systems can all be correct within their definitions while showing different totals.
The difference becomes dangerous when a team treats one number as universally true. A platform may report a conversion on the date of the ad click, while the CRM records revenue on the date the order was paid. One system may count every purchase, another may count one conversion per user, and a third may exclude refunds or test orders. Comparing the headline totals without normalizing those choices creates a discrepancy that is mostly analytical, not technical.
The goal of reconciliation is therefore not perfect equality. The goal is a documented bridge from one system to another. That bridge should explain which records are included, how time is handled, where identifiers can be lost and what level of variance is acceptable for the intended decision.
Review criteria
Name the decision the gap threatens: source ranking, accepted-order cost or finance close. Assign an owner and preserve the original report. Your correction should improve that decision's evidence.
Decision workflow
Move from signal to action in a controlled sequence
Export the inputs, agree the comparison contract, inspect records and classify supported adjustments. Finish with a decision and review trigger.
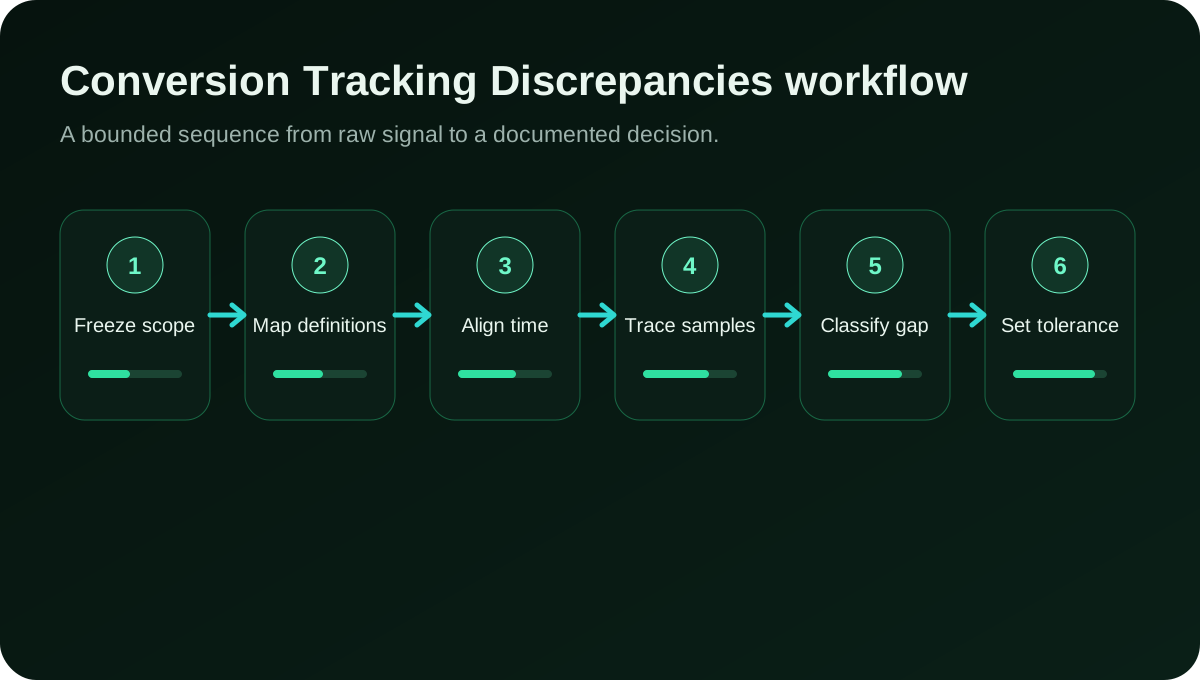
Keep the campaign baseline visible
Compare the same audience and source cohort
Keep the FroggyAds campaign baseline steady. Split the gap by relevant campaign or device fields where available; combined totals can conceal a broken path. Preserve the original export.
Create My Free Account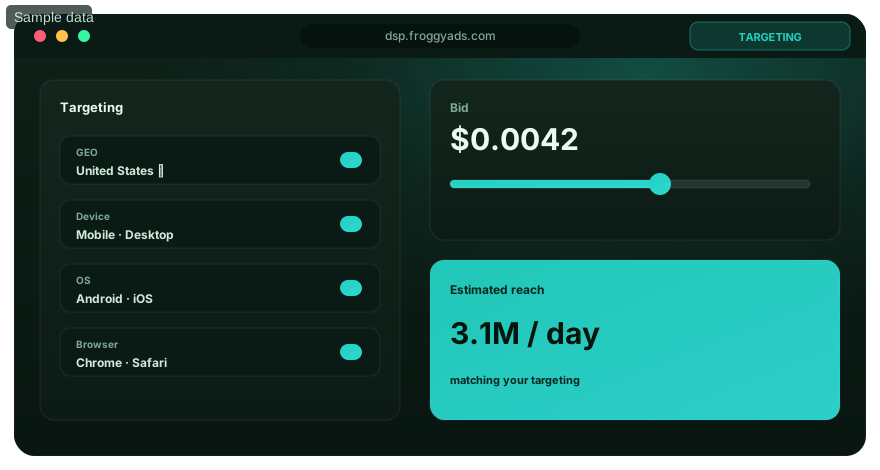
Measurement note
Build a conversion definition sheet before opening dashboards
Create one row for each outcome used in optimization: registration, qualified lead, deposit, purchase, subscription renewal or another accepted business event. Record the event name in every system, the trigger, the expected event ID, the counting rule, the value field, the currency, the attribution window and the business acceptance rule. This sheet prevents teams from comparing events that happen to share a similar label.
Add a field for the reporting date used by each source. Some ad reports assign conversions back to the interaction date. A CRM normally uses the event creation or payment date. Analytics tools can expose both event-time and acquisition-time views. When the dates differ, use a cohort comparison: start with a set of ad interactions from a fixed period, then follow the resulting business outcomes until the chosen window is mature.
Finally, document exclusions. Internal tests, duplicate submissions, refunded orders, rejected leads, canceled subscriptions and fraud decisions can create legitimate differences. Exclusions should be visible and reversible so the team can reproduce the reconciliation later.
Measurement note
Operating rule
Trace identifiers through redirects, domains and checkout steps
Many severe gaps begin with a broken identifier chain. Click IDs, UTM parameters, source IDs and internal session IDs can disappear during redirects, cross-domain navigation, payment-provider handoffs, app transitions or URL cleaning. A conversion can still occur while the system loses the evidence needed to connect it to the originating campaign.
Test the full path on real devices. Capture the landing URL, every redirect, cookies or storage values, the checkout or form submission, the final event payload and the record written to the backend. Confirm that identifiers are encoded safely, stored before navigation and passed only where policy and consent allow. Do not assume that a browser test on one desktop environment represents mobile browsers, in-app webviews or privacy-focused settings.
Use a small set of traceable test records with unique order or lead IDs. One test should follow the normal path, one should include a redirect, one should use a different device class and one should exercise the slowest or most complex checkout route. The objective is to find where identity stops, not merely to confirm that a tag fired.
Operating rule
Match the traffic path to the investigation
Check the format's actual conversion journey
Validate your format's actual landing-to-conversion route before comparing sources. Keep event definitions stable when testing another FroggyAds format so measurement changes do not obscure the result.
Create My Free Account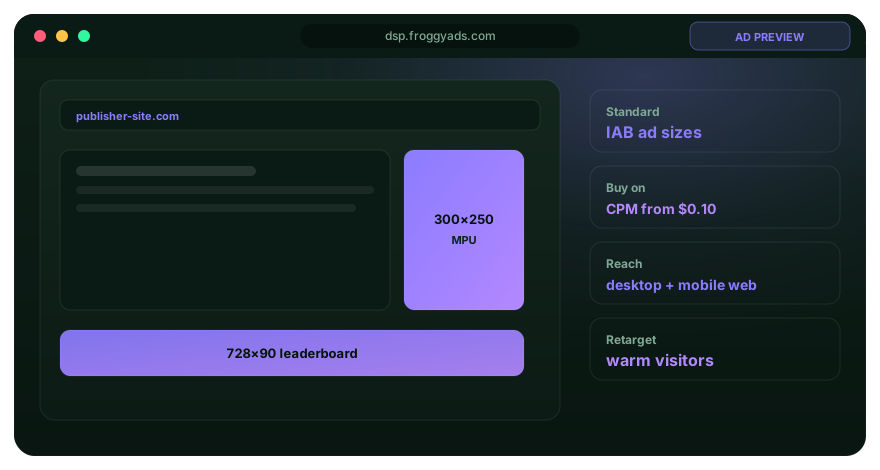
Quality control
Classify the gap before choosing a fix
Place each discrepancy into one of five categories: definition, timing, identity, delivery or processing. Definition gaps come from different events, counting rules or acceptance standards. Timing gaps come from attribution date, conversion lag, time zones or data freshness. Identity gaps come from lost click IDs, cookie limits, cross-device behavior or consent. Delivery gaps come from tags that did not fire, postbacks that failed or payloads that were rejected. Processing gaps come from imports, deduplication, currency conversion or downstream data pipelines.
This classification matters because the fixes are different. Extending the review window can solve an apparent timing gap but will not restore a lost identifier. Adding another tag can worsen a deduplication problem. Changing attribution settings can make reports look closer while hiding a missing backend event. The team should fix the class of problem that the evidence supports.
Keep a residual category for differences that remain explainable but not individually matchable. Privacy controls, modeling, cross-device behavior and vendor-specific methods can create a stable residual. Track its size and direction over time. A stable ten percent gap can be easier to operate with than a gap that swings from minus five to plus forty percent.
Quality control
Review checkpoint
Set a decision tolerance instead of demanding zero variance
The tolerance should match the decision. A daily creative pause can use a broader tolerance than a monthly finance close. A source-level optimization loop needs enough accuracy to rank sources consistently, while a revenue forecast may require reconciliation to accepted orders and refunds. Define the maximum absolute and relative gap that is acceptable for each use case.
Use both percentage and count thresholds. A fifty percent difference sounds severe when one system shows two conversions and another shows three, but the sample is too small for a structural conclusion. A five percent difference across ten thousand orders may represent material revenue. Add a minimum sample requirement before the tolerance is evaluated.
When the gap exceeds tolerance, freeze the affected optimization change, preserve raw logs and assign an owner. When it is within tolerance, document the known causes and continue monitoring. This prevents recurring arguments every time two dashboards display different totals.
Review checkpoint
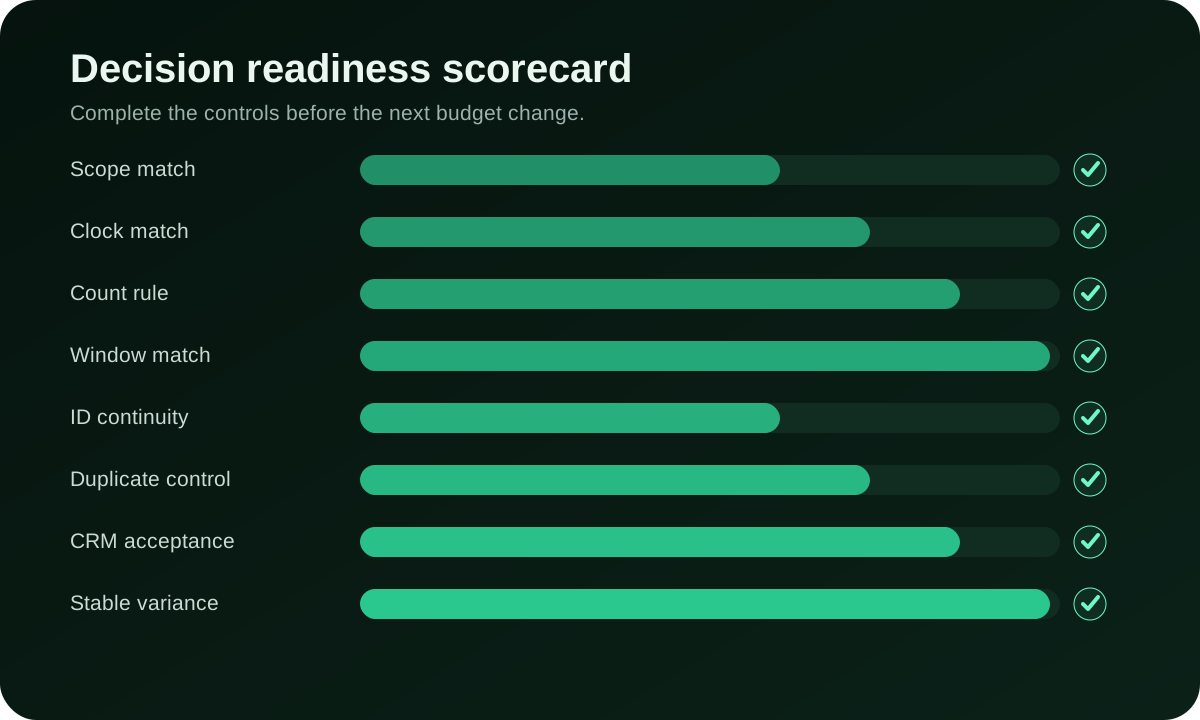
Readiness scorecard
Check the evidence before changing budget or delivery
A complete scorecard does not guarantee the decision is correct, but it reduces avoidable measurement and process errors.
Scope match
Clock match
Count rule
Window match
ID continuity
Duplicate control
CRM acceptance
Stable variance
Resume with evidence
Use the reconciliation to guide your next campaign step
Continue within your budget boundary when the evidence supports it. Defer a source-ranking change if the unresolved gap could reverse that ranking. Evaluate unaffected segments separately.
Create My Free Account
Worked scenarios
Three patterns that change your next action
Use the evidence pattern, not a single metric, to choose the next bounded action.
Platform total is higher than paid orders
The ad platform reports more conversions than the backend. First align dates and windows, then check whether the platform counts leads, payment attempts or modeled conversions while the backend counts only paid orders. Review refunds, duplicate event IDs and the selected count setting. Do not reduce bids solely because the totals differ. Reconcile a cohort of click IDs or order IDs and decide which event should drive optimization.
CRM total is higher than the tracker
The CRM shows more accepted leads than the tracker. Test whether click identifiers survive redirects, form embeds and cross-domain steps. Check consent states, ad blockers, browser restrictions and postback response logs. If accepted leads exist without campaign identity, preserve them in finance reporting but exclude them from source-level conclusions until the identity path is repaired.
The gap changes every day
A volatile gap usually points to timing or pipeline instability. Compare mature cohorts instead of same-day totals, inspect import schedules and verify time zones. Plot the discrepancy by conversion age. If the variance shrinks after three or seven days, the primary issue is reporting maturity. If it remains erratic, review event delivery and duplicate handling.
Limits
What this method cannot prove by itself
Reconciliation cannot recover identifiers that were never collected or were lawfully unavailable. It also cannot make modeled platform data identical to deterministic backend records. Report those limits openly.
A matched total does not prove correct attribution. Two systems can agree because both use the same flawed trigger. Validate the business event and a sample of underlying records, not only the aggregate number.
Rollback rule
Record the last trustworthy report and campaign setting. If a release breaks identity or changes the event definition, protect the affected decision. Verify fresh accepted events before relying on the repaired feed.
Operating record
Keep a discrepancy investigation record that survives the next reporting cycle
A reconciliation is more useful when the team can repeat it. Record the exact date range, time zone, attribution setting, event name, conversion status, currency, device scope and filters used in every system. Include the extraction time because one report may still be processing late events while another has already refreshed. Save the raw totals before applying manual exclusions so the next analyst can reproduce the starting point rather than inheriting an unexplained adjusted number.
Give each observed gap a classification such as timing, attribution, identity, event acceptance, deduplication, currency or consent. Then attach evidence to that classification. A timing gap might be supported by a cohort report that closes after several days. An event acceptance gap might be supported by a rejected payload, missing required field or validation log. The label should describe the mechanism, not assign blame to a platform.
| Record field | What to capture | Why it matters |
|---|---|---|
| Comparison contract | Date range, time zone, attribution rule, event and status | Prevents unlike populations from being compared |
| Observed variance | Absolute difference, percentage difference and direction | Shows scale without hiding the base volume |
| Evidence | Transaction samples, click IDs, timestamps and acceptance logs | Connects the dashboard gap to traceable events |
| Decision | Fix, monitor, accept or escalate with an owner and review date | Turns analysis into a controlled operating action |
Close the investigation only after the correction is tested on new events. Backfilled reports can make a historical chart look repaired without proving that the current collection path is healthy. Use a small set of fresh test conversions, verify identifiers at each handoff, and confirm that the receiving systems accept the same business event once. Keep the accepted tolerance visible so a normal processing difference does not reopen the same investigation every week.
Questions
Conversion tracking discrepancies: FAQ
Practical answers for advertisers, analysts and media buyers.
When does a conversion discrepancy need investigation?
Investigate when the gap exceeds an agreed tolerance, changes suddenly, or affects a budget decision. A small difference can be normal when systems use unlike attribution rules, but unexplained movement deserves a documented check.
What is the goal of a conversion reconciliation?
The goal is to explain the gap well enough to make the intended decision, not force unlike systems to display the same number. Classify differences by definition, timing, identity, status, consent, and technical loss.
How can device behaviour create different conversion totals?
A person may click on one device and convert on another, while each platform links that activity differently. Browser restrictions, app handoffs, and shared devices can also alter identity, so device-level comparisons need careful definitions.
Why do repeat and refunded actions complicate reconciliation?
One system may count the initial event while another keeps only approved, unique, or net orders. Agree on event status and deduplication keys, then compare records at the same stage of the customer action.
What does unresolved tracking drift cost a campaign?
It can send spend toward the wrong source, delay useful optimization, and consume analyst or developer time. Estimate the decisions at risk before launching a large repair project; some small known gaps are cheaper to document.
Which settings should be aligned before comparing platforms?
Match the date range, timezone, attribution window, event definition, filters, currency, and conversion status. Export the same level of detail when possible, and keep the original files so later explanations can be reproduced.
What should a discrepancy report contain?
Show totals from each system, the absolute and percentage gap, matched records, classified causes, unclassified residue, and any decision affected. Include the extraction time and definitions beside the result.
Where should debugging start when conversions disappear overnight?
Check releases, tags, consent behaviour, endpoint responses, credentials, redirects, and reporting delays in time order. Use a fresh test action with traceable identifiers before changing campaign settings or rebuilding the implementation.
How can teams avoid hiding tracking discrepancies?
Use an agreed tolerance, named owner, recurring comparison, and escalation path. Keep adjustments visible instead of silently editing one report to match another. A known difference with evidence is safer than artificial agreement.
When can a reconciled conversion feed support more automation?
Use it after the remaining gap is stable, classified, and acceptable for the decision. Increase automated reliance in stages while monitoring the same reconciliation, because volume or platform changes can introduce new causes.
Continue the workflow
Move from reconciliation to a better campaign decision
Use these guides when the evidence identifies an event-setup, duplicate-handling or attribution-window problem. Keep this investigation focused on explaining different counts.
Run a measured campaign
Start a campaign you can measure confidently
Start your FroggyAds campaign with an agreed measurement contract, a tested accepted event and a bounded budget. Judge sources from reconciled outcomes rather than whichever dashboard refreshes first.
Decision triage
Which discrepancy should change your FroggyAds campaign?
Protect the smallest affected decision. Unmatched orders can reverse a close source ranking; healthy account totals cannot establish a source's quality when its identifiers are missing.
Use three checks before you act: can the populations be compared, could the gap change the decision and can you verify the cause? Use the table to separate diagnosis from campaign response. These are recommended actions, not automatic FroggyAds features.
| Evidence pattern | Investigation | Campaign response |
|---|---|---|
| Timing difference | Compare one interaction cohort at consistent ages; save refresh times. | Keep the budget boundary while events mature; earlier reporting is not better performance. |
| Different event rules | Audit triggers, uniqueness and accepted status for each count. | Use one accepted-event definition for the source comparison. |
| Missing identity | Find the first missing reference in known accepted records. | Retain business outcomes, but defer affected source conclusions until mapping passes. |
| Delivery or processing failure | Match fresh test IDs with payloads, responses and recorded results. | Verify the repaired path on new events before increasing reliance. |
| Explainable residual | Use a fixed reference denominator; inspect segment concentration. | Continue only decisions sound under the uncertainty; reopen when it changes. |
Build a reconciliation packet someone else can reproduce
- Save the inputs: retain raw exports, settings and extraction timestamps so another buyer can reproduce the starting totals.
- Choose the reference: name the decision baseline and denominator before calculating percentages. Switching it later changes the apparent size of the same gap.
- Explain adjustments: keep disjoint record lists and documented reasons. Do not exclude inconvenient results merely to make totals agree.
- Inspect the residual: inspect unmatched IDs and their affected sources or routes. A small global remainder may still distort a low-volume segment.
- Close with a trigger: name the owner and decision supported. Recheck after tracking releases, acceptance-rule changes or a material residual shift.
Why choose FroggyAds for a measured traffic test?
Choose FroggyAds to connect paid traffic with your own tracker through our S2S postback and URL-macro support. Verify the accepted event's campaign reference before increasing spend.
We provide paid traffic; your measurement systems retain distinct roles. Reconciliation explains which evidence supports your next FroggyAds test.
Worked reconciliation
A fictional report bridge: from headline gap to residual
The event-definition foundations are explained in What Is Conversion Tracking. This fictional report bridge compares unlike starting populations; it describes no FroggyAds customer or reporting rule.
A generic ad report has 200 records; the accepted backend cohort has 160 unique outcomes. An audit identifies disjoint exclusions: 20 repeats, 10 outside the cohort and eight failing the agreed acceptance rule. Preserve their evidence. Subtracting these 38 records leaves 162 comparable report records, not a forced match of 160.
| Bridge step | Fictional count | Evidence required |
|---|---|---|
| Raw comparison | 200 report records versus 160 backend outcomes: an initial excess of 40. | Raw exports, cohort, extraction time and backend reference. |
| Classified adjustments | 20 + 10 + 8 = 38 exclusions; 200 - 38 = 162. | Disjoint record lists and reversible exclusion reasons. |
| Unexplained residual | 162 - 160 = +2; +2 / 160 × 100 = +1.25%. | Inspect unmatched records and source concentration; retain the residue. |
Fictional tolerance decision: the raw gap is +40 / 160 = +25%; the normalized residual is +1.25%. This fictional policy permits at most three unexplained records AND 2%, with a 150-outcome minimum reference. Two records, 1.25% and 160 outcomes pass. These illustrative thresholds are not universal; unresolved records still need an owner and could change a close source ranking.
Retain raw, adjusted and residual totals. With a zero reference, report the absolute gap without dividing. When evidence supports the decision, keep the event rule stable for your next FroggyAds test. Create your free FroggyAds account.
Direct answer
What to do when conversion reports disagree
Align the comparison, trace causes and quantify the residual before changing your FroggyAds campaign. Accepted outcomes establish commercial value; linked records support source conclusions.