
CPM Rates: Cost Drivers, Forecasting and Break-Even Planning
Understand CPM rates, the variables that move them, how to forecast spend and how to compare cost with mature business value.
| Section | Distinct excerpt from this page |
|---|---|
| Same maturity | Wait for the normal conversion or revenue adjustment window. |
Reference for CPM Rates: Rates, Budget & Campaign Planning: Google Ads bidding basics Official explanation of CPM and viewable CPM bidding controls..
What cpm rates should mean in a real campaign
CPM Rates cannot be reduced to one universal market number. Rates change with GEO, device, format, source quality, competition, targeting depth, seasonality and the chosen billing definition. The practical task is to forecast a range, compare it with break-even value and update the model as real data matures.
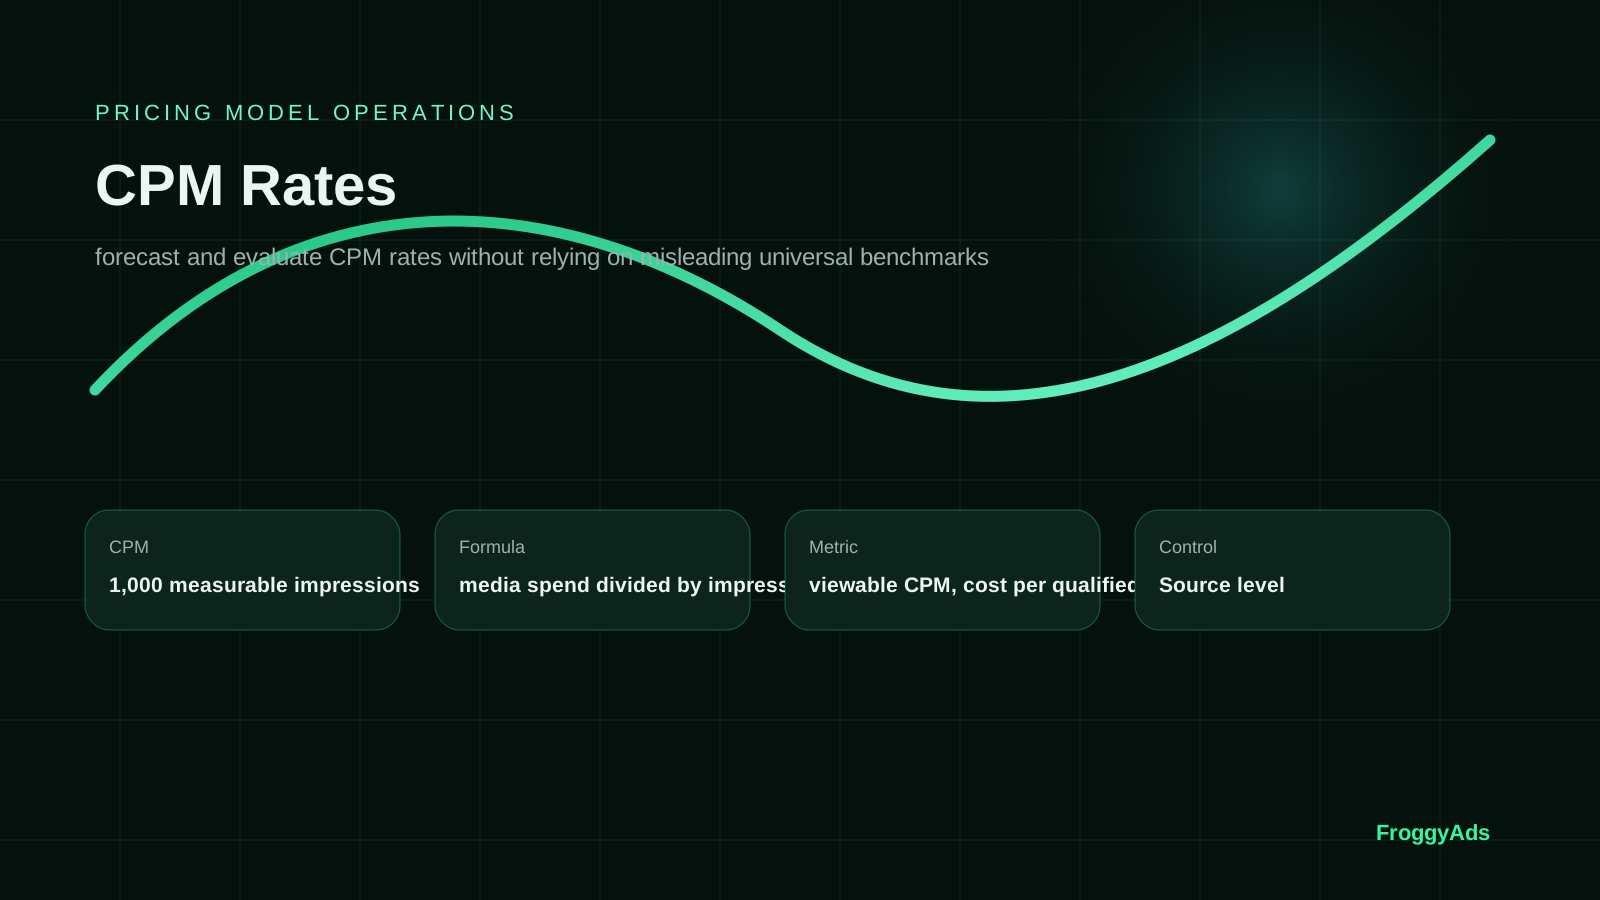
The first cpm rates document should state the billable event, the formula, the attribution window and the accepted business outcome. For this model, the billable unit is 1,000 measurable impressions, and the base formula is media spend divided by impressions, multiplied by 1,000. The formula is only the starting point. The commercial decision should use viewable cpm, cost per qualified visit and mature contribution margin after the underlying outcomes have had enough time to mature.
Use publisher, placement, device, geo, creative, viewability band and frequency as the minimum reporting breakdown. The central risk is buying low-cost impressions that are not viewable, relevant or capable of producing incremental value. A source-level structure, a maximum test loss and a reason-coded change log prevent the team from interpreting a temporary average as a durable result. In this cpm rates workflow, the practical reason for this control is to forecast and evaluate cpm rates without relying on misleading universal benchmarks while preserving a source-level explanation for every material change.
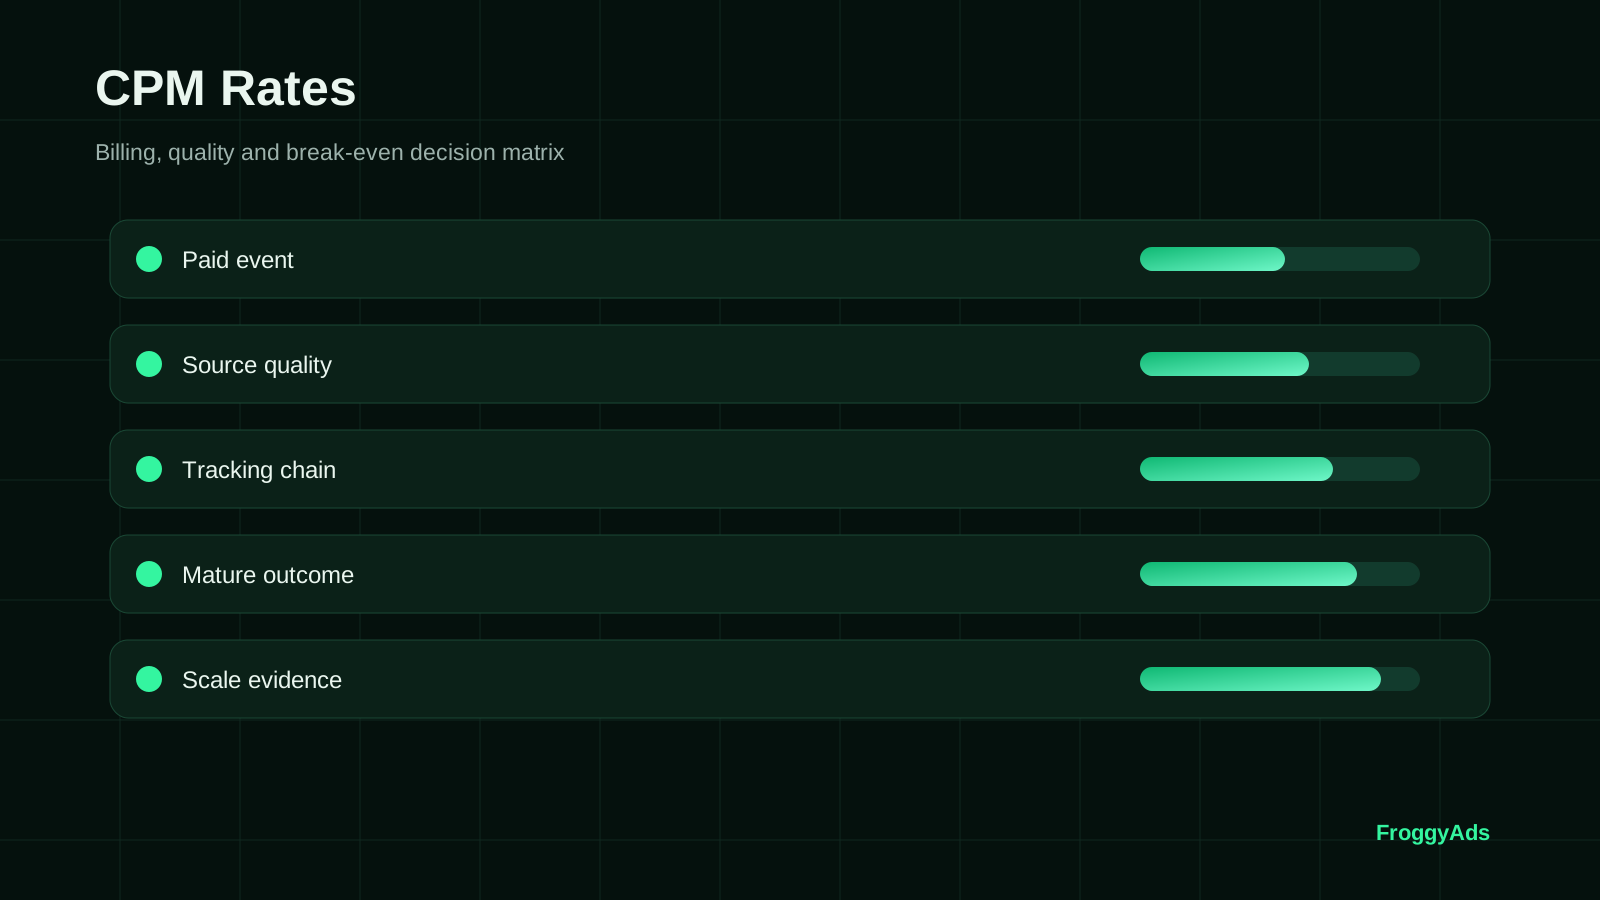
Six layers that make cpm rates measurable
The pricing label becomes useful when billing, source quality, tracking and scale rules are explicit.
Billing definition
Document exactly when a 1,000 measurable impressions is counted, filtered, adjusted and billed. The page should distinguish the configured bid, the effective price and the cost that remains after invalid-event or reconciliation adjustments. For cpm rates, connect this layer with the declared objective and keep the decision reversible until the result matures.
Break-even value
Calculate the maximum affordable media cost from accepted outcome value, variable costs, rejection or reversal rates and required margin. Use viewable cpm, cost per qualified visit and mature contribution margin as the commercial decision layer. For cpm rates, connect this layer with the declared objective and keep the decision reversible until the result matures.
Source transparency
Preserve publisher, placement, device, geo, creative, viewability band and frequency. Source and placement detail lets the team stop waste without discarding the entire model or hiding weak inventory inside a blended account average. For cpm rates, connect this layer with the declared objective and keep the decision reversible until the result matures.
Tracking chain
Carry campaign, source, creative and event identifiers through the landing path. Reconcile platform delivery with served impressions, measurable impressions, viewability, unique reach, qualified visits and accepted outcomes before changing bids or declaring a winner. For cpm rates, connect this layer with the declared objective and keep the decision reversible until the result matures.
Creative and page fit
On this CPM Rates: Cost Drivers, Forecasting and Break-Even Planning page, Creative and page fit matters because it changes what the advertiser should verify before committing budget or operating effort. Keep the review anchored to Match, promise, destination, paid, unit and attractive; those details are the parts of this section that can materially change the recommendation. Set a written pass condition and a rollback condition before acting, so the team can reverse the change without rewriting the history of the test.
Scale governance
Use written stop, revise and scale rules. Increase budget only after the result repeats, the outcome window matures and the next increase remains below the declared break-even limit. For cpm rates, connect this layer with the declared objective and keep the decision reversible until the result matures.
Translate the paid unit into a break-even range
Within CPM Rates: Cost Drivers, Forecasting and Break-Even Planning, Translate the paid unit into a break-even range should connect the page's stated intent to evidence that a media buyer or marketing team can actually inspect. Preserve the source, date and owner for Start, forecast, accepted, Subtract, fulfillment and sales whenever they affect the decision, especially when the page compares options or sets a budget boundary. Set a written pass condition and a rollback condition before acting, so the team can reverse the change without rewriting the history of the test. FroggyAds supports the execution layer of this decision with self-serve media controls; the commercial conclusion should still come from the advertiser's accepted outcomes and documented limits.
Within CPM Rates: Cost Drivers, Forecasting and Break-Even Planning, Translate the paid unit into a break-even range should connect the page's stated intent to evidence that a media buyer or marketing team can actually inspect. The evidence record should make rate, forecast, range, promise, Competition and device visible instead of hiding them inside a blended score or an unexplained recommendation. If the section exposes a measurement gap, repair that gap before changing the offer, creative and targeting simultaneously. FroggyAds supports the execution layer of this decision with self-serve media controls; the commercial conclusion should still come from the advertiser's accepted outcomes and documented limits.
Separate configured values from effective values. A bid ceiling, target or advertised minimum is not necessarily the amount paid. Automated products can adjust delivery or bids within platform-specific rules. The useful report shows the actual cost, the paid denominator and served impressions, measurable impressions, viewability, unique reach, qualified visits and accepted outcomes for the same cohort. In this cpm rates workflow, the practical reason for this control is to forecast and evaluate cpm rates without relying on misleading universal benchmarks while preserving a source-level explanation for every material change.
| Paid unit | 1,000 measurable impressions |
|---|---|
| Base formula | media spend divided by impressions, multiplied by 1,000 |
| Primary business metric | viewable CPM, cost per qualified visit and mature contribution margin |
| Required reporting split | publisher, placement, device, GEO, creative, viewability band and frequency |
| Maturity evidence | served impressions, measurable impressions, viewability, unique reach, qualified visits and accepted outcomes |
Connect the guide to live testing
Connect CPM Rates to a controlled audience test
Use the choices established in “Translate the paid unit into a break-even range” to define one audience, budget and source set in FroggyAds. Keep the surrounding offer and measurement rule stable so the test adds evidence to cpm rates instead of mixing several changes at once.
Create My Free Account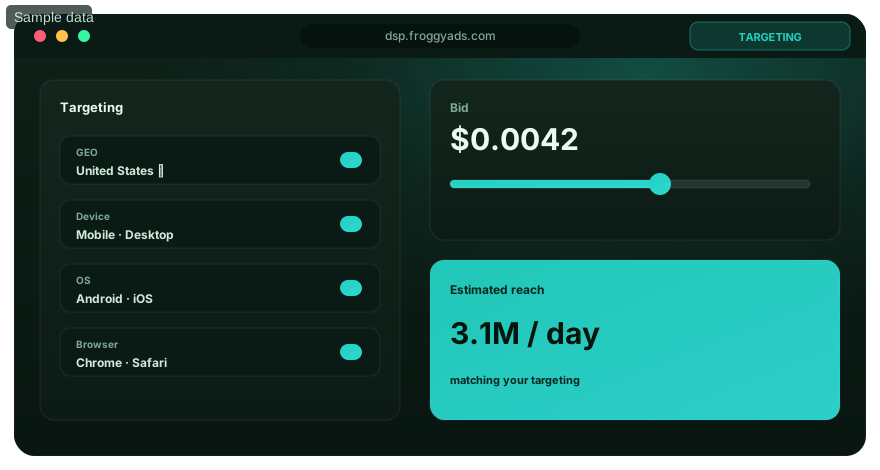
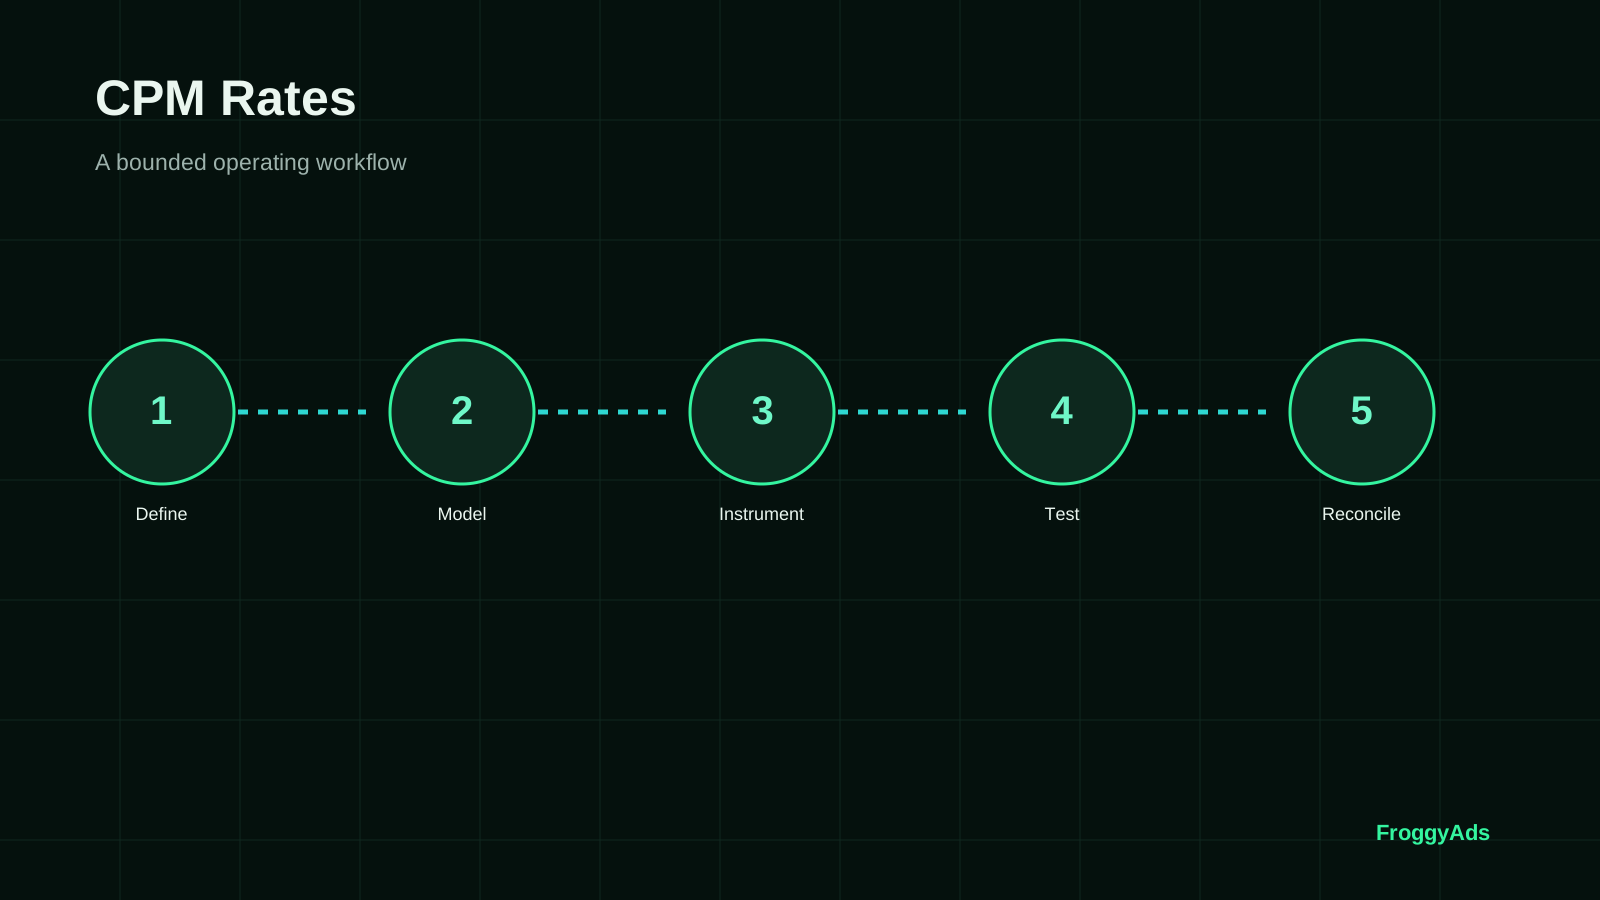
A seven-step cpm rates operating process
Use a bounded sequence so the first budget creates evidence rather than a collection of unrelated changes.
Define the billable event
Write the exact 1,000 measurable impressions definition for cpm rates. Include validation, view or click thresholds, attribution, time zone and any platform-specific adjustments. The cpm rates work log should state the evidence required before the next step begins.
Model the economics
Use media spend divided by impressions, multiplied by 1,000 for the paid unit, then translate that result into viewable cpm, cost per qualified visit and mature contribution margin. Include non-media costs and a margin reserve. The cpm rates work log should state the evidence required before the next step begins.
Instrument the path
Test redirects, landing pages, conversion events, postbacks and source parameters. A pricing-model test is not ready while the paid event and business outcome cannot be reconciled. The cpm rates work log should state the evidence required before the next step begins.
Launch a bounded cell
Choose one offer, a limited GEO and device scope, a small creative set and a maximum test loss. Preserve publisher, placement, device, geo, creative, viewability band and frequency from the first paid event. The cpm rates work log should state the evidence required before the next step begins.
Wait for maturity
Separate provisional and mature results. For cpm rates, do not compare cohorts that have had different time to convert, be approved, generate revenue or reverse. The cpm rates work log should state the evidence required before the next step begins.
Apply reason-coded actions
Mark each change as bid, creative, source, targeting, page, tracking or policy. Record the previous value and the expected effect so the next review can test the hypothesis. The cpm rates work log should state the evidence required before the next step begins.
Scale with a control
Keep a stable control while increasing spend on proven cells. Watch whether effective cost, source mix, frequency, outcome quality or margin changes as the campaign reaches more inventory. The cpm rates work log should state the evidence required before the next step begins.
Reconcile delivery, analytics and accepted value
The headline metric for cpm rates is viewable cpm, cost per qualified visit and mature contribution margin. Define its numerator, denominator, currency, time zone, attribution rule and maturity window before comparing campaigns. Platform delivery, analytics sessions, conversion events, CRM status and collected revenue can settle at different times.
For CPM Rates: Cost Drivers, Forecasting and Break-Even Planning, the Reconcile delivery, analytics and accepted value checkpoint should answer a concrete buyer question rather than repeat a generic framework. Preserve the source, date and owner for Build, reconciliation, table, connects, spend and paid whenever they affect the decision, especially when the page compares options or sets a budget boundary. If the section exposes a measurement gap, repair that gap before changing the offer, creative and targeting simultaneously. Where this leads to paid acquisition, FroggyAds gives you a self-serve campaign environment for applying the relevant targeting, budget and source controls while your own analytics verifies downstream value.
Read early diagnostics without promoting them to final outcomes. Click-through rate, completion rate, viewability, page engagement and raw conversion rate can explain where the path breaks. The budget decision should wait for served impressions, measurable impressions, viewability, unique reach, qualified visits and accepted outcomes to mature. In this cpm rates workflow, the practical reason for this control is to forecast and evaluate cpm rates without relying on misleading universal benchmarks while preserving a source-level explanation for every material change.
Choose the execution format
Choose a paid-media format that supports CPM Rates
Use the criteria around “Reconcile delivery, analytics and accepted value” to decide whether push, native, display or pop fits the message and destination. Set format, targeting and spend as campaign controls in FroggyAds while the cpm rates decision remains the standard for judging the result.
Create My Free Account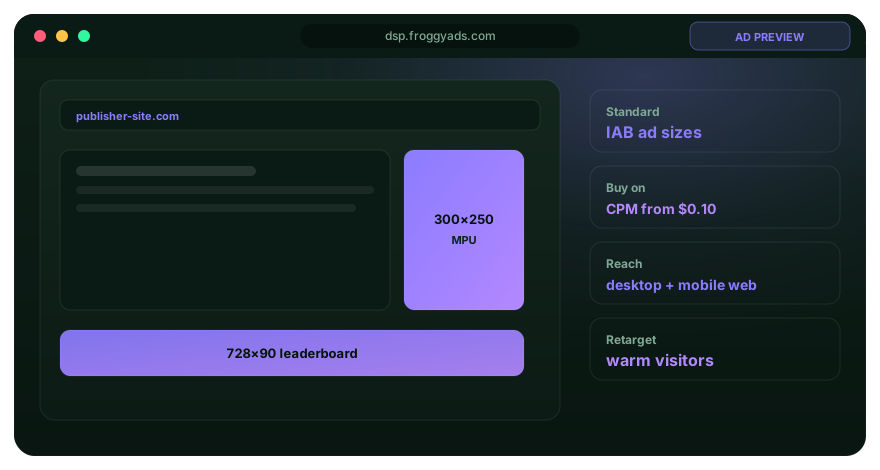
Choose inventory by transparency and control
Volume claims and headline rates cannot replace source-level evidence.
A platform used for cpm rates should expose the billable event, reporting latency, source or placement identifiers, targeting controls, invalid-event treatment and conversion-tracking options. Check whether the account can separate discovery traffic from proven sources and whether changes are available at the level where performance actually differs.
Ask how cost per thousand impressions is implemented for the chosen format. The same label can describe different auction, validation or optimization rules across platforms. For automated variants, document the maximum bid or target, the signals used, the learning period and the advertiser controls that remain available. In this cpm rates workflow, the practical reason for this control is to forecast and evaluate cpm rates without relying on misleading universal benchmarks while preserving a source-level explanation for every material change.
Run the first cpm rates test with a clear loss limit and a narrow question. Compare the platform report with your analytics and business records. A network deserves more budget when the differences are explainable, the quality controls work and the result survives a mature acceptance window.
Make every paid event lead to the same promise
For the CPM Rates: Cost Drivers, Forecasting and Break-Even Planning decision, use Make every paid event lead to the same promise to separate a real operating requirement from a broad best-practice statement. Preserve the source, date and owner for align, creative, landing, path, offer and eligibility whenever they affect the decision, especially when the page compares options or sets a budget boundary. Connect the finding to one owner and one next action so the page helps the visitor decide rather than merely describing a process. If the next step is a media test, FroggyAds lets the advertiser keep campaign settings and source-level performance visible instead of treating traffic volume as proof of success.
Promise
For cpm rates, the ad should state one truthful benefit that the destination can verify.
Qualification
Use the message to attract the user who can complete the accepted outcome, not merely the cheapest 1,000 measurable impressions.
Continuity
Repeat the core reason to act on the landing page so cpm rates performance reflects the offer rather than surprise or confusion.
Speed
Test the destination on purchased devices and connections. Lost sessions distort effective CPM economics.
Proof
Use transparent terms, relevant evidence and realistic expectations. Fabricated urgency or reviews weaken both trust and measurement.
Tracking
Preserve source, placement, creative and event identifiers so the complete cpm rates path remains attributable.
How to respond when cpm rates metrics disagree
Use the disagreement to identify the broken layer instead of changing the entire campaign.
The paid rate falls but CPA rises
The cheaper 1,000 measurable impressions may be coming from weaker sources, lower viewability, accidental response or a landing mismatch. Compare source-level qualified sessions and accepted outcomes before calling the lower rate an improvement. In a cpm rates review, document the diagnosis and the single next change before editing the campaign.
Delivery grows while quality is flat
Expansion may have changed the inventory mix. Hold the best-performing cells stable, isolate the new sources and compare served impressions, measurable impressions, viewability, unique reach, qualified visits and accepted outcomes after the same maturity window. In a cpm rates review, document the diagnosis and the single next change before editing the campaign.
One creative wins early
On this CPM Rates: Cost Drivers, Forecasting and Break-Even Planning page, One creative wins early matters because it changes what the advertiser should verify before committing budget or operating effort. If the section exposes a measurement gap, repair that gap before changing the offer, creative and targeting simultaneously.
Platform and analytics disagree
Check time zones, click IDs, view or click definitions, redirect loss, duplicate rules, consent and attribution windows. Do not average the systems together. Reconcile the event chain with reason codes. In a cpm rates review, document the diagnosis and the single next change before editing the campaign.
The model works in one GEO only
Treat the GEO as a separate economic cell. Price, device mix, payment behavior, language and source availability can change the break-even point. Do not copy the bid into another market without a local test. In a cpm rates review, document the diagnosis and the single next change before editing the campaign.
Scale reduces margin
The larger budget may be reaching more expensive auctions or weaker sources. Return to the last stable level, compare marginal rather than blended performance and increase in smaller steps with source-level limits. In a cpm rates review, document the diagnosis and the single next change before editing the campaign.
Put the guide into practice
Turn CPM Rates into a bounded campaign test
With “How to respond when cpm rates metrics disagree” documented, launch only the next reversible test. Set a spending limit, preserve the baseline and use source-level and audience controls so the next step depends on qualified outcomes for cpm rates, not activity volume.
Create My Free Account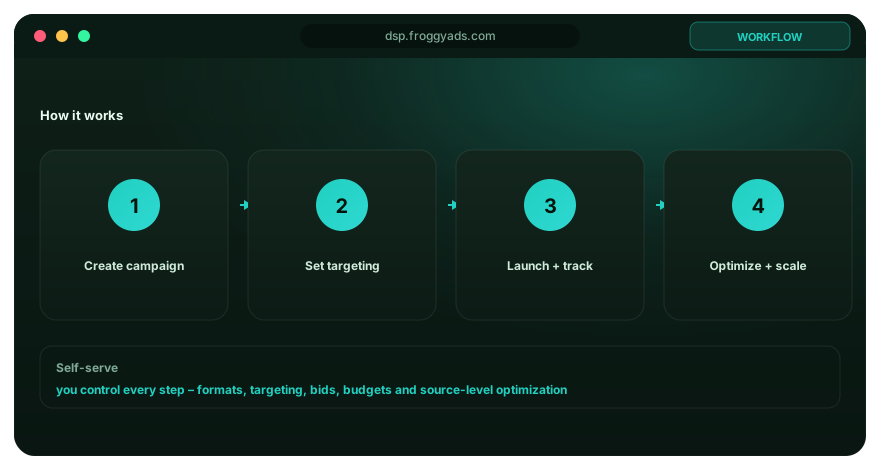
Eight mistakes that weaken cpm rates
Most pricing-model losses come from small definition, tracking and decision defects that survive because the blended account still looks acceptable. Use the checklist before launch and during every material budget review.
- 01Using a different CPM event definition in the platform, analytics and finance reports. Assign an owner, a reason code, a measurable correction and a review date. For CPM Rates, validate this point against CPM Rates, Planning Understand CPM, Understand CPM rates and keep it separate from the CPM Rates In Uk intent.
- 02Comparing cpm rates rates across GEOs, devices or formats without normalizing the denominator. Assign an owner, a reason code, a measurable correction and a review date.
- 03Changing bid, creative, source rules and landing page in the same optimization cycle. Assign an owner, a reason code, a measurable correction and a review date. For CPM Rates, validate this point against CPM Rates, Planning Understand CPM, Understand CPM rates and keep it separate from the CPM Rates In Uk intent.
- 04Scaling provisional conversions before acceptance, retention or revenue has matured. Assign an owner, a reason code, a measurable correction and a review date. For CPM Rates, validate this point against CPM Rates, Planning Understand CPM, Understand CPM rates and keep it separate from the CPM Rates In Uk intent.
- 05Judging cpm rates from a blended account average that hides weak source cells. Assign an owner, a reason code, a measurable correction and a review date.
- 06Treating a lower rate as success while qualified sessions and accepted outcomes decline. Assign an owner, a reason code, a measurable correction and a review date. For CPM Rates, validate this point against CPM Rates, Planning Understand CPM, Understand CPM rates and keep it separate from the CPM Rates In Uk intent.
- 07Allowing tracking loss, duplicate events or attribution differences to remain unexplained. Assign an owner, a reason code, a measurable correction and a review date. For CPM Rates, validate this point against CPM Rates, Planning Understand CPM, Understand CPM rates and keep it separate from the CPM Rates In Uk intent.
- 08Keeping a losing cpm rates segment active because the total campaign is still above break-even. Assign an owner, a reason code, a measurable correction and a review date.
Move from definition to a repeatable CPM decision
For CPM Rates: Cost Drivers, Forecasting and Break-Even Planning, the Move from definition to a repeatable CPM decision checkpoint should answer a concrete buyer question rather than repeat a generic framework. Keep the review anchored to fixed, observation, window, spend, changes and follow; those details are the parts of this section that can materially change the recommendation. Keep the baseline unchanged while testing the next hypothesis; that comparison is what makes the decision reproducible.
Days 1 to 3: define
Document the CPM event, formula, value model, attribution rule and maximum test loss for cpm rates. Verify the destination and every measurement handoff before buying volume.
Days 4 to 10: launch narrow
Run a bounded cpm rates cell with limited GEO, device, sources and creatives. Monitor delivery and obvious technical failures, but avoid rewriting the campaign before representative evidence arrives.
Days 11 to 20: reconcile
Compare platform delivery with served impressions, measurable impressions, viewability, unique reach, qualified visits and accepted outcomes. Separate provisional and mature outcomes, remove repeated failures and keep a small controlled budget for source discovery.
Days 21 to 30: repeat or scale
Increase spend only where viewable cpm, cost per qualified visit and mature contribution margin remains inside the target range. Keep the previous stable setup available and record how the larger auction footprint changes effective cost and source mix. In this cpm rates workflow, the practical reason for this control is to forecast and evaluate cpm rates without relying on misleading universal benchmarks while preserving a source-level explanation for every material change.
Standards and first-party evidence for CPM Rates
On this CPM Rates: Cost Drivers, Forecasting and Break-Even Planning page, Standards and first-party evidence for CPM Rates matters because it changes what the advertiser should verify before committing budget or operating effort. Translate the section into checks for standards, official, documentation, make, operating and your; this keeps the recommendation tied to the page's real task instead of generic marketing language. Set a written pass condition and a rollback condition before acting, so the team can reverse the change without rewriting the history of the test.
- Google Ads bidding basicsOfficial explanation of CPM and viewable CPM bidding controls.
- Google Ads Reach Planner pricingOfficial context for auction, reservation, CPM, CPA and CPV media planning.
- IAB digital advertising glossaryIndustry definition of CPM and impression-based buying.
- AppsFlyer CPM glossaryFirst-party measurement guidance for CPM calculation and use.
CPM Rates FAQ
Answers focus on billing definitions, measurement, quality and responsible scaling.
For CPM Rates, what does a CPM rate actually describe?
It describes the cost of one thousand eligible impressions under a stated spend and delivery definition. Its business meaning still depends on audience, format, placement quality, viewability, and later response.
For CPM Rates, how can a buyer set an initial CPM planning band?
Use recent comparable delivery for the intended audience, format, market, and source, then include a reasonable uncertainty range. Keep the band provisional until live campaign data confirms or replaces it.
For CPM Rates, why can narrow targeting raise CPM without wasting budget?
Scarce audiences can face stronger competition and less inventory, yet they may be more relevant to the offer. Judge the higher rate with reach quality and accepted outcomes rather than price alone.
For CPM Rates, how should creative and landing continuity affect a rate decision?
The ad and destination should present the same offer and conditions in a form suited to the placement. Weak continuity can make sound inventory look uneconomical because the response breaks after exposure.
Which costs sit outside many headline CPM rates?
Data, verification, platform fees, creative work, management, localization, and landing-page preparation may be separate. Include the items needed for the decision and label the media-only figure clearly.
For CPM Rates, what definitions make repeated CPM reports comparable?
Keep currency, period, eligible impression rule, invalid-traffic treatment, fees, market, format, audience, device, and source scope consistent. Document any change before comparing the new rate with history.
For CPM Rates, which quality measures should accompany a CPM rate?
Add viewability, frequency, audience fit, placement or source, useful visits, accepted actions, and relevant value. These measures show if the purchased exposure created a credible opportunity to respond.
For CPM Rates, what should a team inspect after an unexplained CPM shift?
Check raw spend and impressions, auction demand, bids, targeting, format, placement mix, device share, creative eligibility, fees, and currency. Follow the timeline to avoid changing unrelated settings.
For CPM Rates, how can an advertiser limit risk when testing a new rate?
Use a fixed total budget, source and placement controls, frequency limits, quality floors, review points, and clear pause conditions. Keep enough segmentation to identify where an adverse result began.
For CPM Rates, when is a CPM planning range ready for wider use?
Use it more widely after comparable cells show stable cost and quality across enough delivery and downstream response remains acceptable. Treat a new audience, format, country, or source as a fresh cohort.
Continue the pricing and campaign workflow
Use the related resources to connect billing models, source selection, optimization and mature outcome measurement.
Turn cpm rates into a controlled campaign test
When using CPM Rates, apply this rule only to the conditions and decision described on this page. Start with one objective, a precise paid-event definition, transparent tracking, source-level controls and a written stop or scale rule. Results depend on the offer, creative, landing page, GEO, bid and optimization.
Country CPM rates need a comparable evidence basis
Country labels are not enough for a reliable CPM comparison. Fix the format, device, placement, currency, fee basis, date range and impression definition before ranking markets or changing bids.
Same inventory
Compare like-for-like formats and placements.
Same economics
Normalize fees, currency and validation status.
Same maturity
Wait for the normal conversion or revenue adjustment window.
Country CPM comparison methodology
Use these guides to compare CPM Rates by Country.
CPM Rates by Country
Compare CPM rates by country using demand, format, device, viewability, traffic quality, currency and mature net-cost evidence instead of fixed ranking claims.
Cpm Rates: choose the billing model by measurable business value
Direct answer: Cpm Rates should be evaluated by the exact billable event, inventory transparency, conversion tracking, source-level controls and the value produced after validation. A low headline rate is not automatically efficient. Compare qualified outcomes, not only the platform charge.
Define the event before bidding
For CPM Rates, treat this as a page-specific operating check rather than a universal benchmark. Write down what triggers a charge, which events count as qualified, how duplicates and invalid activity are handled, and which reporting window will be used. Keep the media metric separate from the commercial outcome. CPM measures impressions, CPV measures views, CPL measures leads, CPI measures installs and CPA measures an agreed action.
Build a controlled test
For the CPM Rates decision, record how this control changes the next test or review. Use one offer, one landing path, a limited GEO and device scope, consistent conversion tracking and a written stop rule. Review source-level performance before increasing spend. Pause placements that create volume without downstream value, and retain a clean control group so creative, bid and audience changes can be compared.
Use an outcome-normalized score
Calculate cost per validated outcome, approval rate, conversion lag, refund or rejection rate, and mature revenue where available. For impression or view pricing, translate spend into the business event that matters. For action pricing, verify the action definition and attribution logic before treating the nominal rate as comparable.
| Decision area | Question to answer | Practical control |
|---|---|---|
| Billing | What exact event creates cost? | Document the charge definition and reconcile platform logs. |
| Quality | Does traffic produce validated outcomes? | Use postback or server-side tracking and source reports. |
| Economics | What is the mature cost per useful result? | Include approval, retention, refund and revenue signals. |
| Scale | Can spend grow without efficiency collapse? | Raise budgets gradually and preserve stop thresholds. |
Stop and rollback rules
Stop a source when it exceeds the agreed spend cap without enough validated outcomes, when tracking cannot be reconciled, or when downstream quality falls below the business threshold. Roll back to the last stable bid, creative and targeting combination. Do not compensate for weak quality by scaling volume.
Keyword coverage: cpm rates.
CPM Rates: Cost Drivers, Forecasting and Break-Even Planning: the buyer task this URL owns
The buying decision on this URL is specific: performance-focused advertisers should use CPM Rates: Cost Drivers, Forecasting and Break-Even Planning to interpret rate benchmarks without treating them as a guaranteed campaign price. Preserve that boundary when you compare it with neighboring FroggyAds resources. The nearest related FroggyAds page is Cpm Rates In Uk; this URL keeps ownership of the distinct task to interpret rate benchmarks without treating them as a guaranteed campaign price.
For CPM Rates: Cost Drivers, Forecasting and Break-Even Planning, the operating evidence to keep visible is campaign objective, audience targeting, audience and market fit, ad format. Use these entities only when they change setup, measurement or the commercial decision.
| Checkpoint | Page-specific action | Evidence to keep |
|---|---|---|
| Price | Separate published minimums or bids from actual campaign spend. | Retain evidence specific to CPM Rates: Cost Drivers, Forecasting and Break-Even Planning and its accepted outcome. |
| Economics | Define the value of an accepted outcome and the loss boundary. | Retain evidence specific to CPM Rates: Cost Drivers, Forecasting and Break-Even Planning and its accepted outcome. |
| Budget | Use a bounded learning budget before changing scale. | Retain evidence specific to CPM Rates: Cost Drivers, Forecasting and Break-Even Planning and its accepted outcome. |
Hypothetical calculation: if CPM Rates: Cost Drivers, Forecasting and Break-Even Planning converts accepted outcomes at 4% and the maximum acceptable CPA is USD 40, the break-even CPC is 4% x USD 40 = USD 1.6. Replace both inputs with your own economics; this is not a FroggyAds price or performance claim.
FroggyAds gives performance-focused advertisers a self-serve way to act on the CPM Rates: Cost Drivers, Forecasting and Break-Even Planning decision: configure the traffic test, preserve source-level reporting and scale only after the accepted outcome supports the next step. Create your free FroggyAds account.
CPM Rates: Cost Drivers, Forecasting and Break-Even Planning — what matters first
CPM Rates: Cost Drivers, Forecasting and Break-Even Planning is a cost-planning decision: separate published minimums or rates from actual campaign economics, then set a bounded test budget around an accepted business outcome.