
Average CPC Rates: Build a Useful Benchmark
Use average CPC rates as a planning range, then replace the benchmark with source, GEO, format and conversion-quality data from your own campaign.
What does this page explain about Average CPC Rates: Build a Useful Benchmark?
Quick answer: Use average CPC rates as a planning range, then replace the benchmark with source, GEO, format and conversion-quality data from your own campaign. Define the billable event for average cpc rates by documenting the hypothesis, keeping geo, format, source, device, vertical and time period available and recording how the step changes bid, win rate, effective cpc, session quality and conversion value. For Average CPC Rates, pause the newest budget increment when tracking no longer reconciles, qualified behavior declines, a small number of sources dominate unexpectedly, or effective CPC and qualified-session cost exceeds the break-even ceiling.
| Section | Distinct excerpt from this page |
|---|---|
| What average cpc rates should accomplish | Use effective cpc and cost per qualified session to decide whether the current traffic cell deserves a stop, revision, retest or controlled increase. |
| Billable unit | For average cpc rates, connect this control to effective cpc and cost per qualified session and keep geo, format, source, device, vertical and time period visible. |
| Measure mature business value, not delivery alone | The headline decision metric for average cpc rates is effective cpc and cost per qualified session. |
Reference for Average CPC Rates: Build a Useful Benchmark: Google Ads conversion tracking Conversion definition and measurement guidance..
What average cpc rates should accomplish
Average CPC Rates: Build a Useful Benchmark is not a request for more traffic at any price. It is a decision system for matching the offer, audience state, inventory, creative and landing experience to a measurable business outcome. The job on this page is to create a cpc planning benchmark without treating an average as a bid recommendation. That job remains measurable only when the team declares the billable event, the conversion definition, the maturity window and the source-level breakdown before the first meaningful spend.
Start with unit economics. Write the accepted value of the outcome, subtract non-media costs and reserve room for uncertainty, reversals and optimization. The resulting break-even range becomes a guardrail for average cpc rates. Use effective cpc and cost per qualified session as the headline decision metric, then read it beside bid, win rate, effective cpc, session quality and conversion value. This prevents a cheap click, high CTR or early conversion from being mistaken for durable profit.
The central risk is using a broad average that mixes different markets, formats and traffic quality. A controlled structure prevents that failure by separating campaign discovery from scaling, keeping geo, format, source, device, vertical and time period visible and recording every material change. When the campaign team can explain why a result moved, the next budget decision becomes a testable action rather than a reaction to a dashboard average.
Build average cpc rates around six controllable layers
For Average CPC Rates, connect delivery, source visibility, landing behavior, conversion tracking and accepted value to separate operating guardrails.
Billable unit
Define whether cost is attached to an impression, click or action. For average cpc rates, connect this control to effective cpc and cost per qualified session and keep geo, format, source, device, vertical and time period visible.
Quality denominator
Connect the billable unit to qualified sessions or accepted outcomes. For average cpc rates, connect this control to effective cpc and cost per qualified session and keep geo, format, source, device, vertical and time period visible.
Auction context
Keep format, GEO, source, device and competition visible. For average cpc rates, connect this control to effective cpc and cost per qualified session and keep geo, format, source, device, vertical and time period visible.
Measurement window
Use the same conversion and maturity window for comparisons. For average cpc rates, connect this control to effective cpc and cost per qualified session and keep geo, format, source, device, vertical and time period visible.
Effective cost
Calculate the cost of the business outcome, not only the media unit. For average cpc rates, connect this control to effective cpc and cost per qualified session and keep geo, format, source, device, vertical and time period visible.
Risk allocation
Understand which party carries delivery, click and conversion risk. For average cpc rates, connect this control to effective cpc and cost per qualified session and keep geo, format, source, device, vertical and time period visible.
Connect the guide to live testing
Connect Average Cpc Rates to a controlled audience test
Use the choices established in “Build average cpc rates around six controllable layers” to define one audience, budget and source set in FroggyAds. Keep the surrounding offer and measurement rule stable so the test adds evidence to average cpc rates instead of mixing several changes at once.
Create My Free Account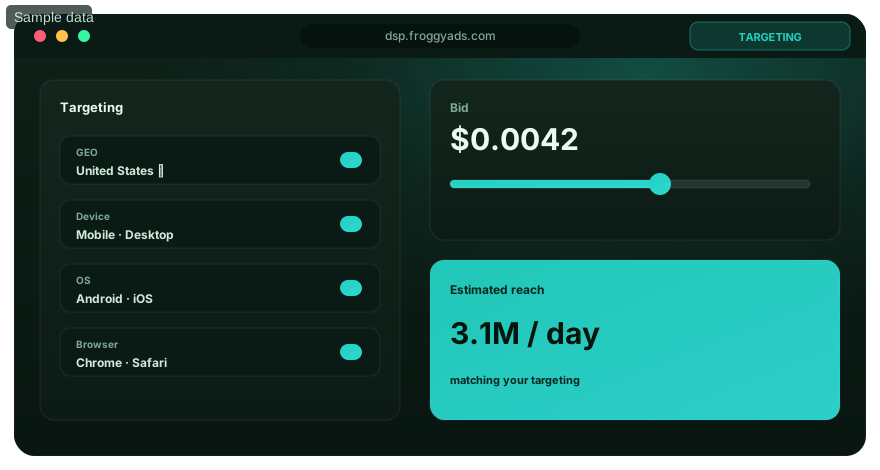
A seven-step average cpc rates process
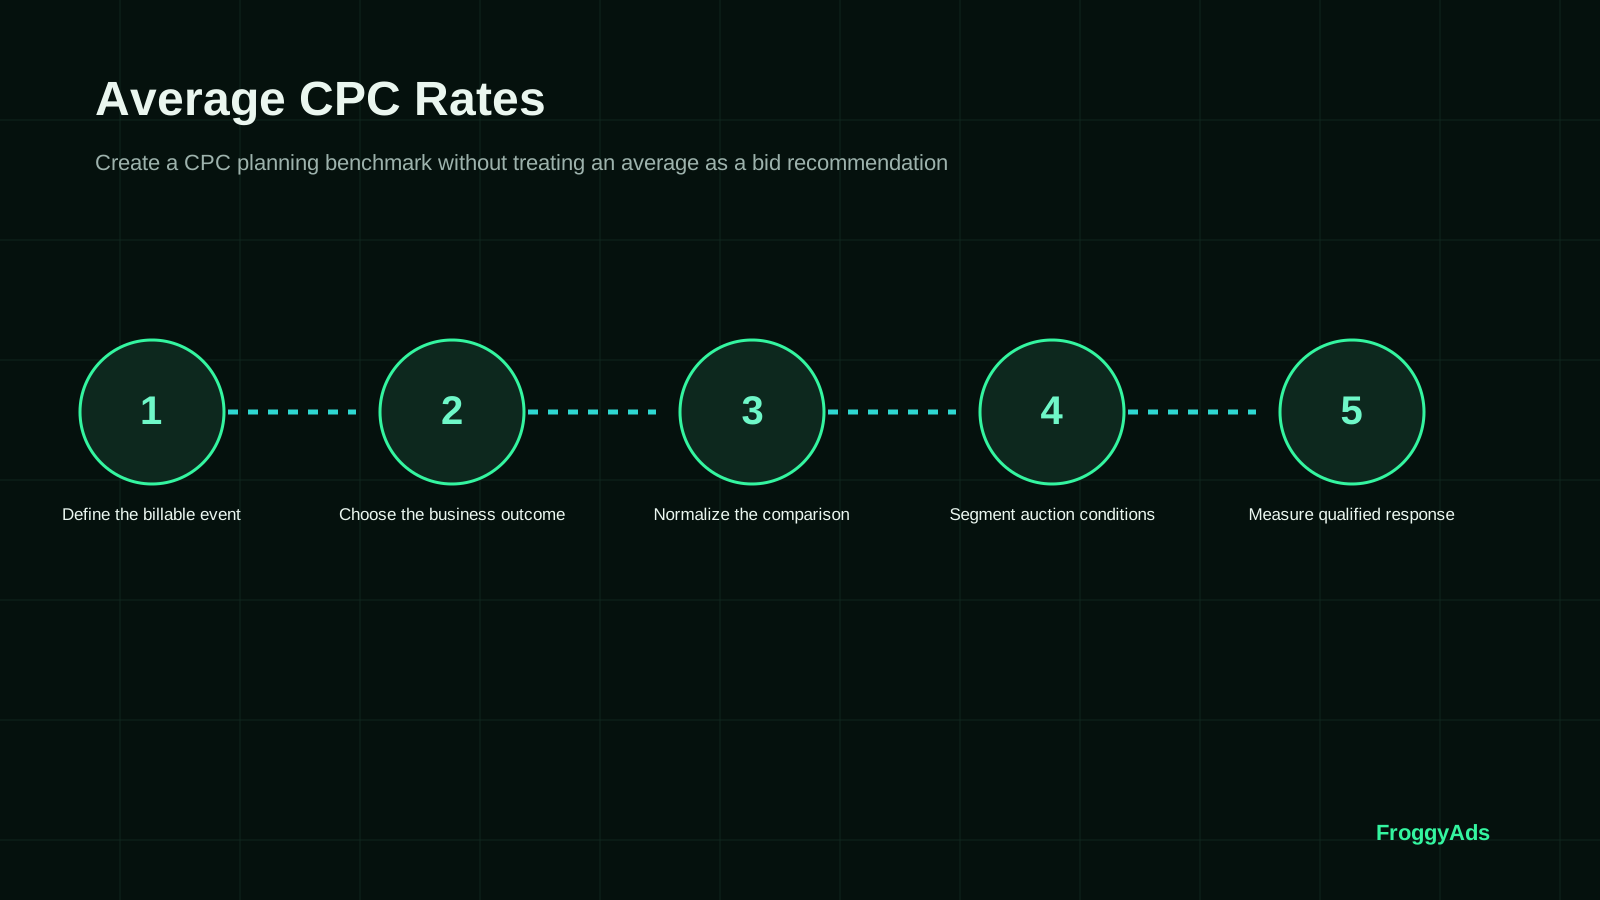
For Average CPC Rates, use a bounded first-budget sequence so each phase tests one defined variable and produces evidence for the next source, creative, bid or scale decision.
Define the billable event
Define the billable event for average cpc rates by documenting the hypothesis, keeping geo, format, source, device, vertical and time period available and recording how the step changes bid, win rate, effective cpc, session quality and conversion value. Do not move to the next step until tracking and the current decision rule are clear.
Choose the business outcome
Choose the business outcome for average cpc rates by documenting the hypothesis, keeping geo, format, source, device, vertical and time period available and recording how the step changes bid, win rate, effective cpc, session quality and conversion value. Do not move to the next step until tracking and the current decision rule are clear.
Normalize the comparison
Normalize the comparison for average cpc rates by documenting the hypothesis, keeping geo, format, source, device, vertical and time period available and recording how the step changes bid, win rate, effective cpc, session quality and conversion value. Do not move to the next step until tracking and the current decision rule are clear.
Segment auction conditions
Segment auction conditions for average cpc rates by documenting the hypothesis, keeping geo, format, source, device, vertical and time period available and recording how the step changes bid, win rate, effective cpc, session quality and conversion value. Do not move to the next step until tracking and the current decision rule are clear.
Measure qualified response
Measure qualified response for average cpc rates by documenting the hypothesis, keeping geo, format, source, device, vertical and time period available and recording how the step changes bid, win rate, effective cpc, session quality and conversion value. Do not move to the next step until tracking and the current decision rule are clear.
Calculate mature effective cost
Calculate mature effective cost for average cpc rates by documenting the hypothesis, keeping geo, format, source, device, vertical and time period available and recording how the step changes bid, win rate, effective cpc, session quality and conversion value. Do not move to the next step until tracking and the current decision rule are clear.
Select the model by evidence
Select the model by evidence for average cpc rates by documenting the hypothesis, keeping geo, format, source, device, vertical and time period available and recording how the step changes bid, win rate, effective cpc, session quality and conversion value. Do not move to the next step until tracking and the current decision rule are clear.
Choose the execution format
Choose a paid-media format that supports Average Cpc Rates
Use the criteria around “A seven-step average cpc rates process” to decide whether push, native, display or pop fits the message and destination. Set format, targeting and spend as campaign controls in FroggyAds while the average cpc rates decision remains the standard for judging the result.
Create My Free Account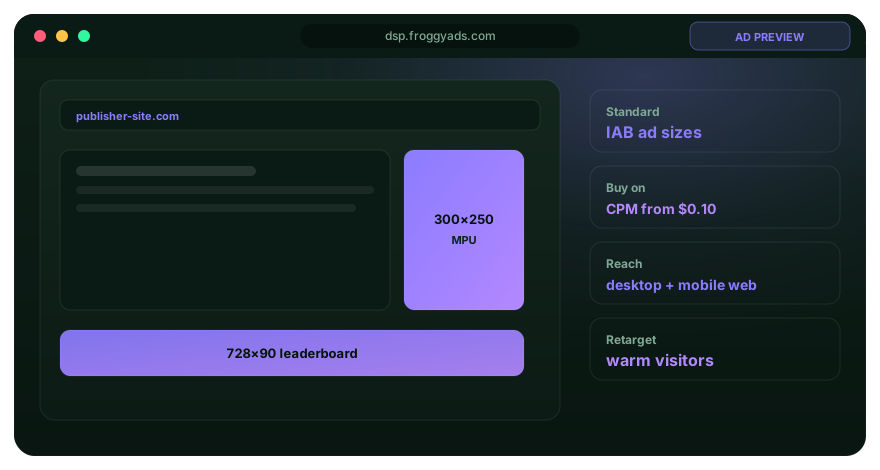
Measure mature business value, not delivery alone
The headline decision metric for average cpc rates is effective cpc and cost per qualified session. Define its numerator, denominator, currency, attribution rule and maturity window before comparing campaigns. Platform delivery, analytics events, network approvals and collected revenue can settle at different times. Keep recent results provisional until they have the same opportunity to mature.
Report the result by geo, format, source, device, vertical and time period. This breakdown is not optional administration. It shows whether an apparent improvement came from a different auction, a stronger source, a more qualified audience, a creative change or a temporary traffic mix. Pair the economic metric with bid, win rate, effective cpc, session quality and conversion value so a short-term efficiency gain does not hide weaker acceptance or lower future scale.
Use a reconciliation table that connects ad spend, click IDs, landing sessions, raw conversions, approved conversions and payout or business value. Differences need reason codes such as attribution delay, invalid event, duplicate, cap, policy rejection or tracking loss. For average cpc rates, the campaign is not ready to scale while the largest gaps remain unexplained.
| Layer | Evidence | Guardrail | Decision |
|---|---|---|---|
| Delivery | Impressions, clicks and reachable sessions | Technical validity and source visibility | Confirm eligible volume |
| Engagement | Page load, qualified visit and meaningful action | Message match and page experience | Keep or revise the path |
| Conversion | Raw and approved outcomes | Attribution and approval rules | Calculate mature acquisition cost |
| Value | Bid, win rate, effective CPC, session quality and conversion value | Effective CPC and cost per qualified session | Stop, retest or scale |
Put the guide into practice
Turn Average Cpc Rates into a bounded campaign test
With “Measure mature business value, not delivery alone” documented, launch only the next reversible test. Set a spending limit, preserve the baseline and use source-level and audience controls so the next step depends on qualified outcomes for average cpc rates, not activity volume.
Create My Free Account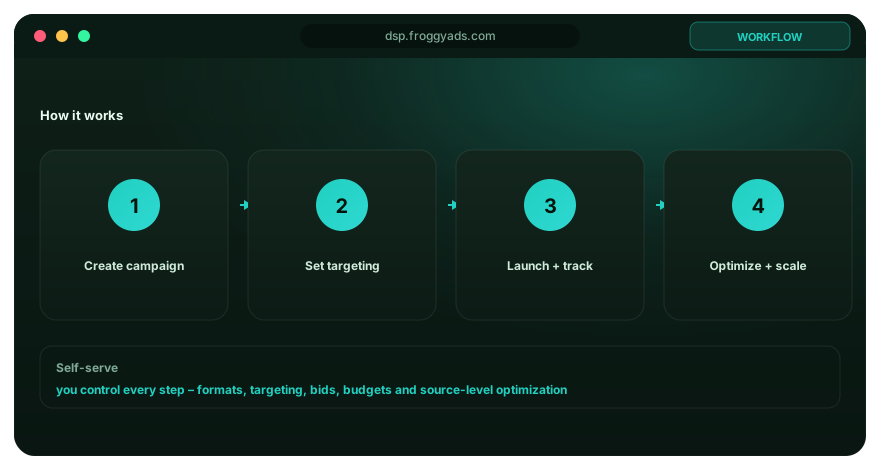
Connect creative, landing path and accepted conversion for Average CPC Rates
A resilient average cpc rates campaign separates traffic eligibility, auction delivery, click handling, landing-page behavior, conversion reporting and final acceptance. Each stage can fail independently. A click can be billable but never load the page, a conversion can be recorded but later rejected, and an approved action can still be unprofitable after media and operating costs. Mapping those stages prevents the team from optimizing the wrong layer.
Use a small number of campaign cells. Each cell should represent a meaningful hypothesis about the offer, source, GEO, device, creative angle or landing path. Give the cell a budget, bid range, loss limit, evidence threshold and maturity date. This structure makes average cpc rates easier to read than one broad campaign with dozens of hidden interactions.
Keep discovery separate from scaling. Discovery spends a bounded amount to find new sources, placements or messages. Scaling spends more on mature cells that meet the economic rule. Mixing both jobs causes successful sources to hide exploration losses and makes it difficult to know whether the account is growing or simply consuming a past winner. For average cpc rates, use this principle to support the page's specific objective: create a CPC planning benchmark without treating an average as a bid recommendation.
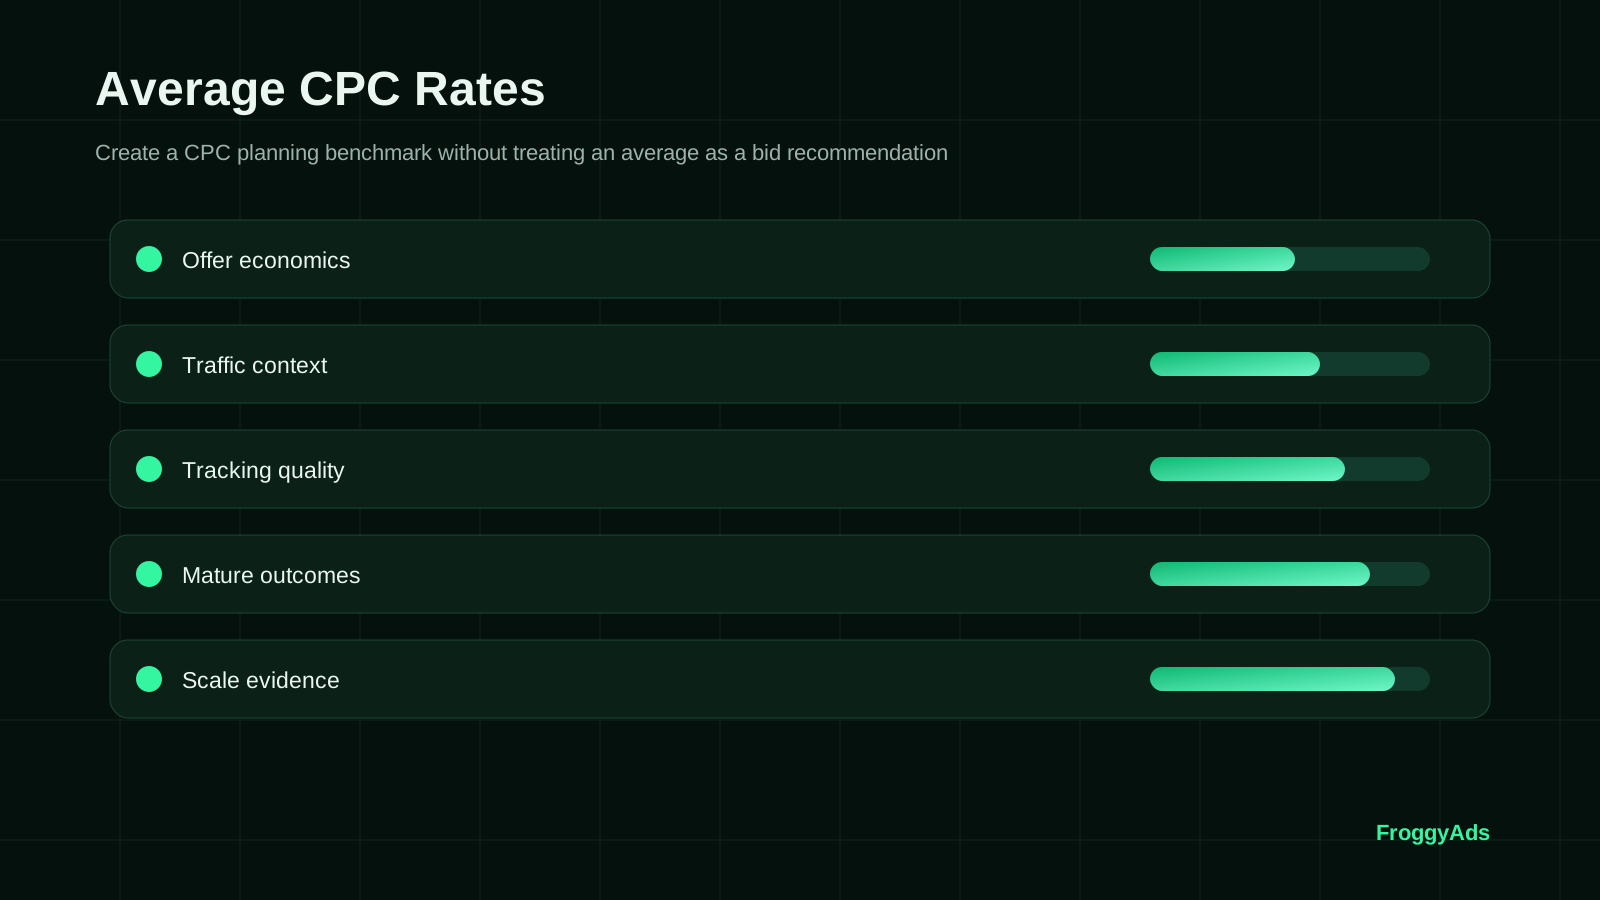
Make the user journey for Average CPC Rates coherent from placement to conversion
For Average CPC Rates, align creative, landing path, offer eligibility and the accepted conversion definition so the campaign is measured against one coherent user journey.
Promise
State one truthful reason to engage. For average cpc rates, the promise should fit the format and avoid claims that the destination cannot verify.
Continuity
For Average CPC Rates, carry the same core promise, visual cues and next action into the landing page; abrupt message changes make source and creative quality harder to diagnose.
Speed
For Average CPC Rates, test page load and interaction on the devices and connection conditions being bought; lost sessions can make a viable source look unqualified.
Qualification
For Average CPC Rates, give the visitor enough context to understand eligibility, material terms and the final action before conversion; direct paths may need more explanation when restrictions or disclosures apply.
Proof
For Average CPC Rates, use verifiable product details, transparent terms and relevant evidence; avoid fabricated reviews, false urgency and unsupported performance claims.
Tracking
Preserve campaign, source, placement and creative identifiers through the complete path so average cpc rates decisions remain attributable.
How to respond when the metrics disagree
When metrics for Average CPC Rates disagree, isolate delivery, source, creative, landing path, tracking or acceptance before changing the whole campaign.
CPM is low, acquisition cost is high
Check viewability, creative response and landing-page quality. For average cpc rates, compare the response with effective cpc and cost per qualified session, preserve the source breakdown and write the next action before changing the campaign.
CPC is high, margin is strong
Do not optimize away qualified clicks that produce accepted value. For average cpc rates, compare the response with effective cpc and cost per qualified session, preserve the source breakdown and write the next action before changing the campaign.
CPA looks stable, volume disappears
Inspect approval rules, caps, attribution and whether the action definition changed. For average cpc rates, compare the response with effective cpc and cost per qualified session, preserve the source breakdown and write the next action before changing the campaign.
Eight mistakes that weaken average cpc rates
Most paid traffic losses are not caused by one dramatic error. They come from small measurement, targeting and decision defects that remain active because the blended account still looks acceptable. Use the list as a pre-launch and weekly review checklist. For average cpc rates, use this principle to support the page's specific objective: create a CPC planning benchmark without treating an average as a bid recommendation.
- 01Optimizing average cpc rates from an immature conversion or payout window. Use a reason code, review date and measurable correction rather than a vague optimization note.
- 02Changing bid, creative, landing page and targeting together during the same average cpc rates test. Use a reason code, review date and measurable correction rather than a vague optimization note.
- 03Using a blended campaign average for Average CPC Rates can hide weak sources, placements or devices. Record the affected segment, reason code, review date and measurable correction.
- 04Judging Average CPC Rates performance by delivery metrics without checking accepted business value can reward the wrong segment. Record the decision metric, reason code, review date and measurable correction.
- 05Increasing spend for Average CPC Rates before tracking, redirects and postbacks reconcile can amplify bad data. Record the mismatch, reason code, review date and correction before scaling.
- 06Allowing one winning creative or source in Average CPC Rates to become an untested dependency creates concentration risk. Record a diversification test, review date and fallback.
- 07Ignoring disclosure, destination quality or offer traffic restrictions in Average CPC Rates creates avoidable compliance and conversion risk. Record the applicable rule, owner, review date and correction.
- 08Keeping losing segments in Average CPC Rates active because the account-level result is still positive can hide marginal waste. Record the segment threshold, reason code and next action.
Move from instrumentation to a repeatable decision
Use a fixed observation window for Average CPC Rates so spend changes follow mature conversion evidence instead of early delivery noise or endless low-volume testing.
Days 1 to 3: instrument
Validate the destination, campaign parameters, source identifiers and conversion events for average cpc rates. Record the break-even assumption and the maximum spend that can be lost while still learning something useful.
Days 4 to 10: launch narrow
Run one focused average cpc rates test with a small creative set and a limited targeting scope. Watch delivery, page function and obvious source outliers, but avoid rewriting the campaign before meaningful response data arrives.
Days 11 to 20: reconcile
Compare platform events with bid, win rate, effective cpc, session quality and conversion value. Separate mature and provisional outcomes, remove segments that violate stop rules and preserve a controlled discovery budget for new sources.
Days 21 to 30: repeat or scale
Increase spend only where effective cpc and cost per qualified session remains inside the target range and the result is not dependent on one unstable cell. Document what changed and keep the previous stable setup available for rollback.
Standards and first-party evidence for Average CPC Rates
Use standards and official platform documentation for Average CPC Rates, then make operating decisions from your own reconciled source, campaign and backend data.
- Google Ads bidding basicsFirst-party overview of CPC, CPM and conversion-oriented bidding.
- Google Ads conversion trackingConversion definition and measurement guidance.
- IAB Tech Lab OpenRTBAuction and bid-request context for programmatic inventory.
- Google Analytics attributionAttribution and conversion-path reporting context.
Average CPC Rates FAQ
Answers for Average CPC Rates focus on measurement, campaign control and responsible scaling.
What does an average CPC rate actually describe?
It is the total click cost divided by billed clicks for a defined campaign scope and period, not a universal market price.
Why do CPC benchmarks vary between reports?
Audience, market, device, format, auction pressure, season and inclusion rules differ, so two averages may describe unlike traffic. Compare matching definitions and reporting windows.
Should an advertiser use mean or median click cost?
The mean supports spend reconciliation, while the median can reveal a typical observation. Review the distribution and outliers beside both.
How can a team build its own CPC benchmark?
Freeze the date range and filters, reconcile billed cost and clicks, then segment only where the sample remains useful. Keep a written explanation for any difference between platform and billing records.
Does a low cost per click signal good traffic?
Not necessarily. Connect click cost with qualified behavior, accepted conversions and downstream value before judging efficiency. Allow the conversion window to mature before comparing cohorts.
Which fees belong in an effective CPC calculation?
Include the media charge and any unavoidable platform, currency or service costs tied to acquiring those clicks. Use the same currency and reporting period for the comparison.
How should invalid or refunded clicks be treated?
Follow the billing record, document credits separately and keep the adjustment date so the calculation can be reproduced. Keep invalid and refunded activity visible instead of silently changing the denominator.
Can average CPC set the right campaign bid?
It offers context, but the maximum sensible bid comes from conversion probability, accepted customer value and the buyer's margin limit.
When should a CPC benchmark be refreshed?
Update it after meaningful changes in market, format, targeting, competition or pricing, and label the period it represents. Recheck that the click definition and cost inputs still match.
What should accompany a published CPC figure?
Name the source, market, dates, currency, traffic scope, calculation method and limitations so readers can decide whether it applies. Explain any exclusions or unresolved reporting differences.
Continue the paid traffic workflow
Use related resources for Average CPC Rates to connect source selection, campaign execution, pricing and measurement.
Turn average cpc rates into a controlled campaign test
For Average CPC Rates, start with one accepted business outcome, transparent tracking, source-level controls and a written stop-or-scale rule. Judge the test by offer fit, creative, landing path, GEO, bid, conversion maturity and downstream acceptance.
Build a benchmark that can survive real campaign data
Direct answer: Average CPC Rates: Average CPC is account-specific: total click cost divided by clicks. GEO, auction pressure, intent, quality and placement mix change the observed result. Treat published averages as orientation only. Build a break-even ceiling from conversion rate and accepted outcome value, record the configured bid separately from actual cost, and replace broad benchmarks with mature account data before scaling.
Keywords consolidated here: average cpc rates.
Write the measurement contract
For average cpc rates, document the billable event as a valid click. Define invalid-event filtering, attribution window, accepted outcome and delayed reversals. This prevents a platform total from being treated as confirmed business value.
Constrain the first test
For Average CPC Rates, use one objective, limited targeting and a fixed maximum loss. Keep creative and landing-page conditions stable long enough to read effective CPC and qualified-session cost. Add complexity only after the first decision is resolved.
Preserve source-level control
A Average CPC Rates test should retain campaign, creative, source, placement, device and GEO identifiers wherever available. Separate configured bid, actual media cost, qualified behavior and accepted outcomes so weak delivery can be stopped without discarding the whole test.
Scale from marginal value
Scale Average CPC Rates spend in measured steps. Compare the newest budget increment with the last stable cohort rather than relying on a blended lifetime average. Roll back when tracking divergence, source concentration or accepted outcome cost moves outside the declared ceiling.
| Decision layer | Evidence to record | Why it matters |
|---|---|---|
| Access | Account eligibility, deposit or billing terms | Confirms whether the platform can be tested without misreading account opening as usable delivery. |
| Media event | a valid click | Makes CPC, CPM, CPA, CPV or install reporting comparable to the actual contract. |
| Quality | Qualified sessions, engagement, activation or accepted outcomes | Separates cheap delivery from useful audience response. |
| Economics | effective CPC and qualified-session cost | Connects media buying to break-even value and protects against scaling a low-quality average. |
| Control | Source exclusions, caps, bid limits and rollback notes | Keeps the experiment reversible when delivery or platform automation changes. |
Seven-step operating workflow
- Define the business outcome and maximum acceptable cost.
- Confirm the paid event, filtering and billing terms.
- Validate analytics, click IDs and conversion callbacks.
- Limit the first campaign to a small number of test cells.
- Review source-level quality before changing bids or creative.
- For Average CPC Rates, wait for delayed approvals, reversals, refunds, activation or retention signals to mature before excluding a source or declaring a winner.
- For Average CPC Rates, scale, revise, retest or stop from mature marginal value at source or test-cell level rather than early volume alone.
Stop and rollback rule
For Average CPC Rates, pause the newest budget increment when tracking no longer reconciles, qualified behavior declines, a small number of sources dominate unexpectedly, or effective CPC and qualified-session cost exceeds the break-even ceiling. Restore the last stable source set and budget, then change one variable at a time.
Evidence hierarchy
For Average CPC Rates, prefer reconciled first-party outcomes over platform-estimated conversions, source-level cohorts over blended totals, and mature value over early click or impression volume. Use published rates and budget guidance as planning inputs, not guarantees for a particular GEO or campaign.
What this owner does not promise
Average CPC Rates does not promise a universal rate, guaranteed traffic quality, a fixed conversion result or automatic profitability. Inventory, auctions, audience response and policies change. The purpose is to make the test measurable, attributable and reversible.
Primary reference set: Google average CPC definition, goal-based bidding guidance, Google budget guidance, Meta budget guidance and the IAB glossary. Verify current platform settings in the active account before launch. For Average CPC Rates, apply this rule to the page-specific audience, market, format or buying decision described here.
Average cost per click: canonical scope and decision controls
Direct answer: Average cost per click is already owned by the established average CPC guide, which calculates total click cost divided by total clicks and explains why rates vary by market and traffic quality.
For Average CPC Rates: Build a Useful Benchmark, a second page for the assigned wording would repeat the same definition, examples or cost framework and create avoidable cannibalization. This owner is materially expanded so the exact wording is answered while the site preserves one strong canonical resource for the intent.
Definition boundary
State the billable event, campaign scope and business question before comparing performance or costs.
Measurement contract
Reconcile spend and platform events to analytics and accepted business outcomes with documented attribution rules.
Quality control
Review queries, placements, invalid activity, duplicate outcomes and rejection reasons instead of relying on volume alone.
Decision rule
Use a capped test, a break-even threshold and a reversible keep, revise, pause or expand decision.
Official references
Average CPC Rates: Build a Useful Benchmark: the buyer task this URL owns
Treat Average CPC Rates: Build a Useful Benchmark as an operating page for performance-focused advertisers, not as a synonym page. Its job is to help you interpret rate benchmarks without treating them as a guaranteed campaign price, with the evidence kept against this exact decision. The nearest related FroggyAds page is What Is Cpc Advertising; this URL keeps ownership of the distinct task to interpret rate benchmarks without treating them as a guaranteed campaign price.
The page-specific control set for Average CPC Rates: Build a Useful Benchmark is campaign objective, audience targeting, audience and market fit, ad format. Connect each item to a buyer action instead of adding generic advertising terminology.
| Checkpoint | Page-specific action | Evidence to keep |
|---|---|---|
| Price | Separate published minimums or bids from actual campaign spend. | Retain evidence specific to Average CPC Rates: Build a Useful Benchmark and its accepted outcome. |
| Economics | Define the value of an accepted outcome and the loss boundary. | Retain evidence specific to Average CPC Rates: Build a Useful Benchmark and its accepted outcome. |
| Budget | Use a bounded learning budget before changing scale. | Retain evidence specific to Average CPC Rates: Build a Useful Benchmark and its accepted outcome. |
Hypothetical calculation: if Average CPC Rates: Build a Useful Benchmark converts accepted outcomes at 5% and the maximum acceptable CPA is USD 40, the break-even CPC is 5% x USD 40 = USD 2.0. Replace both inputs with your own economics; this is not a FroggyAds price or performance claim.
Choose FroggyAds when Average CPC Rates: Build a Useful Benchmark calls for a controlled paid-media test. We let performance-focused advertisers apply relevant format, targeting and budget controls, keep source-level evidence visible, and measure the accepted outcome before increasing spend. Create your free FroggyAds account.
Average CPC Rates: Build a Useful Benchmark — what matters first
Average CPC Rates: Build a Useful Benchmark is a cost-planning decision: separate published minimums or rates from actual campaign economics, then set a bounded test budget around an accepted business outcome.