Customer case study 74

Travel Direct Click Traffic Case Study: 417% ROI in Denmark

An anonymized FroggyAds customer campaign turned $4,475 in media spend into $23,135 in gross revenue. This analysis covers the setup, optimization controls, creative testing, measurement chain and scaling decisions recorded for the campaign.

Customer identity and offer name are withheld. Figures and optimization observations are based on the customer-provided performance record.

Ad spend$4,475reported total
Gross revenue$23,1355.17x ROAS
Net profit$18,660after media spend
Total ROI+417%profit ÷ spend
Campaign performance summary for Travel Direct Click Traffic in Denmark

What does this page explain about Travel Direct Click Traffic Case Study: 417% ROI in Denmark?

Quick answer: See how a travel campaign used direct click traffic in Denmark to generate $23,135 revenue and 417% ROI. This anonymized customer campaign focused on travel inquiries or bookings in Denmark. The campaign preserved the supplied CID TRAV-DK-0034 as the reference for the analyzed record. Net profit was $18,660, which corresponds to the reported 417% ROI and a calculated 5.17x return on ad spend.

Reference for Travel Direct Click Traffic Case Study: 417% ROI in Denmark: FTC guidance on online advertising and marketing.

Editorial review for Travel Direct Click Traffic Case Study: 417% ROI in Denmark: , .

Campaign overview

This anonymized customer campaign focused on travel inquiries or bookings in Denmark. The buyer used Direct Click Traffic through FroggyAds and reported 131,388 generated clicks, 1,815 reported conversions, $23,135 in gross revenue and $18,660 in net profit. The resulting 417% ROI is calculated as net profit divided by media spend.

The headline result came from a campaign that had to operate across 965 active publishers with a reported average bid win rate of 76.2%. Those delivery figures describe market access, not automatic quality. The customer still needed to identify which combinations of source, device, creative and landing experience produced commercially accepted outcomes.

Travel campaigns are sensitive to availability, price changes and destination fit. The buyer needed to connect the ad promise with a current, usable booking path.

The Danish funnel kept the message concise, clarified the software action before the click and preserved a consistent experience across device types.

The campaign was managed as a chain of evidence. Delivery metrics explained exposure, conversion records explained user action, and downstream value determined whether the traffic was commercially useful.

What the record demonstrates

A controlled combination of offer fit, localization, tracking, creative testing and source-level optimization produced a profitable historical result. It does not guarantee the same outcome for another advertiser.

The acquisition challenge

The implied cost per verified conversion was $2.47, while gross revenue averaged $12.75 per verified conversion. Those two figures created the working space for media cost, operational variance and downstream quality. A source could not be judged only by its click price because a cheap click with weak conversion value would still consume the margin.

The campaign produced a calculated 1.38% click-to-conversion rate and $0.176 in gross revenue per click. The buyer used these values as reconciliation points, not universal targets. Device mix, source pricing and conversion delay could change the same ratios even when the offer stayed constant.

The record also shows why test design matters in Denmark. A broad launch was useful for discovery, but a broad campaign left unchanged would have mixed high-value cohorts with segments that had not yet earned additional spend. The customer therefore moved from exploration into more isolated source and device groups.

Price, availability, taxes, restrictions and cancellation terms should be presented accurately.

Campaign setup and targeting

Direct Click reduced creative layers and placed more responsibility on offer selection, routing, page speed and the first seconds of the destination experience.

The buyer used tightly controlled destination variants, preserved source and click identifiers through redirects and removed extra steps that did not improve qualification.

The campaign preserved the supplied CID TRAV-DK-0034 as the reference for the analyzed record. Source identifiers, creative identifiers and conversion feedback were treated as a connected measurement path. That allowed the buyer to compare the original traffic purchase with the customer outcome rather than optimizing from disconnected reports.

The starting structure gave Direct Click Traffic enough breadth to test delivery while keeping the acceptable loss explicit. Publisher segments that accumulated spend without a verified outcome were candidates for reduction, while segments with repeatable conversions could move into separate scale groups.

The reported 76.2% average win rate was interpreted together with source quality. Raising bids could improve access to a segment, but it could also change the auction mix. The buyer reviewed performance again after material bid or budget changes instead of assuming the original efficiency would remain constant.

  • GEO: Denmark (DK)
  • Format: Direct Click Traffic
  • Primary objective: User acquisition
  • Campaign reference: TRAV-DK-0034
  • Reported publisher coverage: 965
  • Average bid win rate: 76.2%

Tracking and data quality

Server-to-server conversion feedback connected the advertiser-side event with the campaign click and source identifiers. This reduced dependence on browser-only signals and helped the buyer distinguish a delivery problem from a tracking or landing-page problem.

The source document describes a fast, geographically distributed landing setup with a target time to first byte below 120 milliseconds. The practical lesson is not that one latency number guarantees conversion. It is that redirects, script weight and unstable mobile rendering can create apparent traffic-quality issues that begin on the advertiser side.

The customer reconciled the reported 1,815 conversions with the accepted business event for travel. FroggyAds traffic-quality controls can reduce exposure to invalid activity, but they do not replace advertiser-side validation, duplicate handling or downstream acceptance rules.

The campaign’s calculated CPC of $0.034 was useful for budget planning, while the $2.47 cost per verified conversion remained the more important commercial boundary. The difference between those metrics shows why optimization stopped at neither impressions nor clicks.

Conversion maturity was included in the decision process. A segment that appeared weak before delayed events arrived could be removed too early, while a strong early cluster could look better than it was if later quality or refund data had not matured.

Optimization controls

How the campaign was reviewed without exposing customer or publisher identifiers

The customer supplied aggregate campaign results. The public version deliberately omits publisher IDs, device and operating-system combinations, carrier rows and other granular data that cannot be independently validated from the public record.

Source-level review

The buyer separated placements by downstream conversion quality, not click volume alone, and used source controls to isolate weak and promising traffic pockets.

Tracking reconciliation

Campaign IDs and conversion events were reconciled between the advertiser tracker and the FroggyAds reporting view before budget changes were approved.

Controlled allocation

Budget changes were made in measured steps with rollback thresholds. Public case studies do not publish customer source IDs or unverified device-level combinations.

Creative process

Creative testing was managed as a controlled learning cycle

The original public draft included precise creative-level CTR figures that were not independently auditable. The revised case keeps the supportable operating method and removes those granular claims.

One variable at a time

Each test changed one meaningful element, such as the hook, image, call to action or landing-page transition, so the buyer could interpret the result.

Conversion quality first

Click response was treated as an early signal. A creative advanced only when downstream conversions and accepted customer events remained economically useful.

Separate test and scale pools

New variations stayed in a controlled test allocation while mature winners retained stable budgets. This reduced the risk of replacing a proven asset too quickly.

Document the decision

The buyer recorded what changed, the observation window and the next action. Public summaries describe the process without publishing unverifiable creative-level precision.

Campaign results

The reported totals and calculated efficiency metrics

Raw customer totals are paired with transparent calculations so the headline ROI can be evaluated in context.

These are customer-reported historical campaign results supplied to FroggyAds. The public summary is anonymized and has not been independently audited. Results are not a forecast, guarantee or universal benchmark — The reported totals and calculated efficiency metrics.

Clicks generated131,388965 active publishers
Reported conversions1,8151.38% calculated CVR
Cost per conversion$2.47$0.034 cost per click
Revenue efficiency5.17x$0.176 revenue per click

At the final reported totals, $4,475 in media spend generated $23,135 in gross revenue. Net profit was $18,660, which corresponds to the reported 417% ROI and a calculated 5.17x return on ad spend.

The 131,388 clicks produced 1,815 reported conversions. This creates a calculated conversion rate of 1.38%, a revenue-per-click figure of $0.176 and a revenue-per-conversion figure of $12.75.

These figures should be read as one historical campaign record. They show that the offer, format, market and optimization process worked together during the measured period. They do not establish a guaranteed rate card or a forecast for another advertiser.

The scale result also depended on the customer’s ability to recognize accepted value. For travel, that meant looking beyond the front-end event toward qualified inquiry, completed booking and revenue after cancellation effects. Without that connection, the same campaign could have appeared profitable while sending weak or ineligible outcomes downstream.

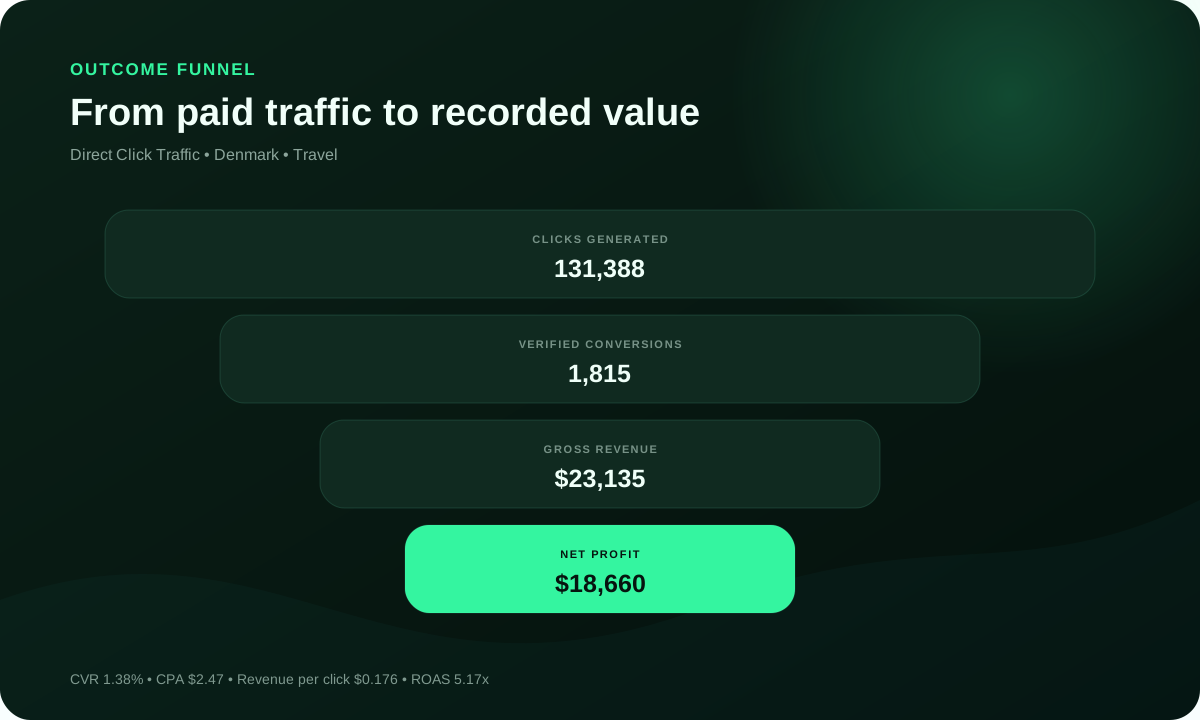
Outcome funnel for the Travel campaign

Reading the outcome funnel

The funnel connects the traffic total with the verified action and the financial result reported for the campaign.

  • 131,388 clicks produced 1,815 reported conversions.
  • Each verified conversion cost $2.47 in media spend.
  • Gross revenue averaged $12.75 per verified conversion.
  • Net profit was $18,660, equal to 417% of media spend.
MetricCalculated valueInterpretation
Cost per click$0.034Media spend divided by generated clicks
Conversion rate1.38%Reported conversions divided by clicks
Cost per conversion$2.47Media spend divided by reported conversions
Revenue per click$0.176Gross revenue divided by clicks
Revenue per conversion$12.75Gross revenue divided by reported conversions
Return on ad spend5.17xGross revenue divided by media spend
Scaling process

How the campaign moved from exploration to controlled budget growth

The customer used source separation, creative evidence, loss limits and rollback points instead of treating scale as a single budget increase.

The team evaluated direct-click placements by accepted conversion cost, not raw visit volume. High-performing sources were isolated so budget increases did not reopen every test placement.

The team protected the original control structure while creating higher-budget copies of the winning combination. That made it easier to distinguish more volume from a real improvement in efficiency.

The broad test campaign remained a discovery environment. Once a source and creative combination developed enough evidence, the buyer moved it into a more controlled structure with its own budget and bid logic. This protected proven segments from the volatility of continued exploration.

Stop rules were defined before each meaningful increase. If cost per accepted outcome moved outside the declared boundary, if source composition changed sharply or if downstream quality weakened, the campaign could return to the previous budget level rather than waiting for the full test budget to disappear.

The final 417% ROI reflected the complete measured period, including exploration and scaling. The customer did not remove the learning cost from the headline result. That makes the reported number more useful than a narrow screenshot of only the best-performing day.

A practical replication plan would begin with the decision logic, not the final bid. Another advertiser should recalculate conversion value, source maturity, creative requirements, legal eligibility and maximum acceptable loss before borrowing any part of the campaign structure.

Test

Launch enough source and creative breadth to learn, while keeping the maximum acceptable loss explicit.

Refine

Separate weak source, creative and destination combinations. Preserve the combinations that produce repeatable accepted outcomes.

Scale

Increase budget in measured steps and return to the previous level if cost, quality or source composition leaves the declared boundary.

Practical takeaways

What advertisers can learn from this Travel case

The transferable value is the decision process, not the assumption that another campaign will reproduce the same ROI.

What supported the historical result

  • One measurement path connected the source, creative, destination and accepted customer event.
  • Localization covered the complete post-click journey.
  • Source-level data remained visible during optimization.
  • Creative tests were interpreted with conversion and revenue data.
  • Budget increases were staged and reversible.

What must be recalculated for a new campaign

  • The accepted conversion and its real value.
  • The maturity window for delayed or adjusted outcomes.
  • The legal and policy eligibility of the offer and GEO.
  • The maximum test loss and rollback rule.
  • The source, device and landing-page mix available at launch.
Method and source note: Performance totals, campaign format, GEO and optimization observations come from a customer-provided FroggyAds campaign record in FROGGYADS SCALING BLUEPRINTS. Calculated metrics are derived from those totals. Customer identity, offer identity and dates are withheld. Results reflect one historical campaign and do not guarantee future performance.
Case study FAQ

Questions about the campaign

For Travel Direct Click Traffic Case Study, who can learn from the Denmark travel direct-click case?

A travel advertiser with similar destination eligibility and reliable booking measurement can examine the approach while treating its own campaign as independent evidence.

For Travel Direct Click Traffic Case Study, which costs should be considered when reading the travel case study?

Include media, Danish localisation, creative, booking technology, customer service and the effect of cancellations or unaccepted reservations. Quick answer: See how a travel campaign used direct click traffic in Denmark to generate $23,135 revenue and 417% ROI.

For Travel Direct Click Traffic Case Study, what evidence makes the direct-click case interpretable?

Review campaign dates, traffic definition, accepted booking event, attribution rule, source exclusions and the arithmetic behind the displayed return. The transferable value is the decision process, not the assumption that another campaign will reproduce the same ROI.

For Travel Direct Click Traffic Case Study, how can an advertiser adapt the Denmark method cautiously?

Select one relevant campaign choice, apply it to a capped audience cell and compare results with a newly captured baseline.

For Travel Direct Click Traffic Case Study, why does localisation matter for Danish travel customers?

Language, prices, dates, availability and support information should remain coherent from the first message through the booking path. This anonymized customer campaign focused on travel inquiries or bookings in Denmark.

For Travel Direct Click Traffic Case Study, how is quality checked in a travel direct-click test?

Link attributed visits to valid booking records, then examine source-level duplication, unnatural timing and unusually high cancellation. This anonymized customer campaign focused on travel inquiries or bookings in Denmark.

For Travel Direct Click Traffic Case Study, when would another campaign example be more useful?

Use a different case when its destination, transaction path or format more closely resembles the planned travel offer. This anonymized customer campaign focused on travel inquiries or bookings in Denmark.

For Travel Direct Click Traffic Case Study, which calculations support the adaptation decision?

Compare campaign spend, accepted bookings, net booking value and rejected or cancelled activity within a fixed measurement window. The original public draft included precise creative-level CTR figures that were not independently auditable.

For Travel Direct Click Traffic Case Study, why is the case-study ROI not a promise for another advertiser?

The published outcome arose from particular inventory, timing and offer economics that a separate campaign will not reproduce exactly. This anonymized customer campaign focused on travel inquiries or bookings in Denmark.

For Travel Direct Click Traffic Case Study, what should happen after the small Denmark campaign?

Preserve source and booking evidence, then expand only a passing segment under a new cap and the same acceptance definition.

Advertisers & brands

Turn the next campaign into a measured growth story

Launch with a clear conversion boundary, source-level visibility and a plan for controlled optimization.

$50min deposit
7-daymoney-back
750+SSP sources
FroggyAds media buyer
FroggyAds support specialist
FroggyAds agency lead
FroggyAds advertiser
FroggyAds growth marketer
15,000+advertisers live
Adscore controlstraffic available throughout campaign workflows