Customer case study 51

Sweepstakes Popunder Ads Case Study: 196% ROI in Indonesia

An anonymized FroggyAds customer campaign turned $11,387 in media spend into $33,705 in gross revenue. This analysis covers the setup, optimization controls, creative testing, measurement chain and scaling decisions recorded for the campaign.

Customer identity and offer name are withheld. Figures and optimization observations are based on the customer-provided performance record.

Ad spend$11,387reported total
Gross revenue$33,7052.96x ROAS
Net profit$22,318after media spend
Total ROI+196%profit ÷ spend
Campaign performance summary for Sweepstakes Popunder Ads in Indonesia

What does Sweepstakes Popunder Ads Case Study: 196% ROI in Indonesia actually show?

Direct answer: Sweepstakes Popunder Ads Case Study documents a reported campaign setup, its measured result, and the limits that affect transferability. We connect campaign overview, the record demonstrates, and the acquisition challenge within one scope. First, identify the Sweepstakes Popunder Ads Case Study outcome, evidence window, and decision owner. Next, examine campaign overview and the record demonstrates for the same audience and objective. Also, verify the acquisition challenge before you increase budget, reach, or commitment. For context, this Sweepstakes Popunder Ads Case Study review uses 3 source checks and 3 steps. However, you still need page-specific evidence before drawing a Sweepstakes Popunder Ads Case Study conclusion. Therefore, keep FTC guidance on online advertising beside the FroggyAds evidence when rules affect the decision. Finally, keep the Sweepstakes Popunder Ads Case Study decision reversible until the evidence meets your stated rule.

Topic
Sweepstakes Popunder Ads Case Study: 196% ROI in Indonesia
Primary decision
campaign overview compared with the record demonstrates.
Required control
the acquisition challenge within the same audience, timeframe, and evidence boundary.
Decision pointVisible evidenceWhat you should verify
Sweepstakes Popunder Ads Case Study: 196% ROI in Indonesia scopeThe page evaluates campaign overview, the record demonstrates, and the acquisition challenge.Keep each criterion within the same stated audience and purpose.
Documented methodThe Sweepstakes Popunder Ads Case Study review uses 3 source checks and 3 action steps.Confirm each check before recording a conclusion.
Review dateThe editorial review date is 2026-08-02.Recheck the Sweepstakes Popunder Ads Case Study guidance when rules, inputs, or costs change.
Evidence table for Sweepstakes Popunder Ads Case Study: 196% ROI in Indonesia. The counts describe this page's review method, not a promised market or campaign outcome.

How should you act on Sweepstakes Popunder Ads Case Study: 196% ROI in Indonesia?

  1. Record the reported Sweepstakes Popunder Ads Case Study audience, setup, period, and result exactly as stated.
  2. Separate the transferable method from conditions that your campaign cannot reproduce.
  3. Try a smaller validation test, then compare it with your own acceptance rule.

Use boundary: This Sweepstakes Popunder Ads Case Study page supports a documented decision. It does not replace current platform rules, qualified advice, or evidence from your own implementation.

Decision record: sweepstakes-popunder-ads-case-study | continue | revise | stop

For Sweepstakes Popunder Ads Case Study, evidence should change the next decision; it should never be presented as a guarantee.

FroggyAds Editorial Team

External reference: FTC guidance on online advertising and marketing. This source defines the wider context for Sweepstakes Popunder Ads Case Study; FroggyAds statements remain company-supplied guidance.

Reviewed by the on . For Sweepstakes Popunder Ads Case Study: 196% ROI in Indonesia, the review covered campaign overview, the record demonstrates, and the acquisition challenge. The team reviews programmatic advertising, media buying, traffic-quality controls, and campaign measurement.

Campaign overview

This anonymized customer campaign focused on eligible entries and downstream value for a sweepstakes promotion in Indonesia. The buyer used Popunder Ads through FroggyAds and reported 293,034 generated clicks, 1,077 reported conversions, $33,705 in gross revenue and $22,318 in net profit. The resulting 196% ROI is calculated as net profit divided by media spend.

The headline result came from a campaign that had to operate across 403 active publishers with a reported average bid win rate of 74.7%. Those delivery figures describe market access, not automatic quality. The customer still needed to identify which combinations of source, device, creative and landing experience produced commercially accepted outcomes.

Sweepstakes traffic can generate inexpensive entries that later fail eligibility, consent or value checks. The campaign therefore needed clear rules for what counted as an accepted conversion.

Indonesian-language messaging was paired with mobile connection and device segmentation, allowing the buyer to isolate where conversion quality changed.

The buyer kept enough separation between creative, source and device variables to understand why performance changed rather than reacting to one blended dashboard average.

What the record demonstrates

A controlled combination of offer fit, localization, tracking, creative testing and source-level optimization produced a profitable historical result. It does not guarantee the same outcome for another advertiser.

The acquisition challenge

The implied cost per verified conversion was $10.57, while gross revenue averaged $31.30 per verified conversion. Those two figures created the working space for media cost, operational variance and downstream quality. A source could not be judged only by its click price because a cheap click with weak conversion value would still consume the margin.

The campaign produced a calculated 0.37% click-to-conversion rate and $0.115 in gross revenue per click. The buyer used these values as reconciliation points, not universal targets. Device mix, source pricing and conversion delay could change the same ratios even when the offer stayed constant.

The record also shows why test design matters in Indonesia. A broad launch was useful for discovery, but a broad campaign left unchanged would have mixed high-value cohorts with segments that had not yet earned additional spend. The customer therefore moved from exploration into more isolated source and device groups.

Eligibility, age, geography, prize terms, privacy and consent requirements should be explicit and consistent with local promotion rules.

Campaign setup and targeting

Popunder traffic supplied high-volume full-page visits that made landing-page speed, source controls and post-click qualification especially important.

The buyer treated the destination as the primary creative surface, tested clear pre-lander variants and separated source IDs so high-volume placements could be judged on mature outcomes.

The campaign preserved the supplied CID SWEE-ID-0011 as the reference for the analyzed record. Source identifiers, creative identifiers and conversion feedback were treated as a connected measurement path. That allowed the buyer to compare the original traffic purchase with the customer outcome rather than optimizing from disconnected reports.

The starting structure gave Popunder Ads enough breadth to test delivery while keeping the acceptable loss explicit. Publisher segments that accumulated spend without a verified outcome were candidates for reduction, while segments with repeatable conversions could move into separate scale groups.

The reported 74.7% average win rate was interpreted together with source quality. Raising bids could improve access to a segment, but it could also change the auction mix. The buyer reviewed performance again after material bid or budget changes instead of assuming the original efficiency would remain constant.

  • GEO: Indonesia (ID)
  • Format: Popunder Ads
  • Primary objective: User acquisition
  • Campaign reference: SWEE-ID-0011
  • Reported publisher coverage: 403
  • Average bid win rate: 74.7%

Tracking and data quality

Server-to-server conversion feedback connected the advertiser-side event with the campaign click and source identifiers. This reduced dependence on browser-only signals and helped the buyer distinguish a delivery problem from a tracking or landing-page problem.

The source document describes a fast, geographically distributed landing setup with a target time to first byte below 120 milliseconds. The practical lesson is not that one latency number guarantees conversion. It is that redirects, script weight and unstable mobile rendering can create apparent traffic-quality issues that begin on the advertiser side.

The customer reconciled the reported 1,077 conversions with the accepted business event for sweepstakes. FroggyAds traffic-quality controls can reduce exposure to invalid activity, but they do not replace advertiser-side validation, duplicate handling or downstream acceptance rules.

The campaign’s calculated CPC of $0.039 was useful for budget planning, while the $10.57 cost per verified conversion remained the more important commercial boundary. The difference between those metrics shows why optimization stopped at neither impressions nor clicks.

Conversion maturity was included in the decision process. A segment that appeared weak before delayed events arrived could be removed too early, while a strong early cluster could look better than it was if later quality or refund data had not matured.

Optimization controls

How the campaign was reviewed without exposing customer or publisher identifiers

The customer supplied aggregate campaign results. The public version deliberately omits publisher IDs, device and operating-system combinations, carrier rows and other granular data that cannot be independently validated from the public record.

Source-level review

The buyer separated placements by downstream conversion quality, not click volume alone, and used source controls to isolate weak and promising traffic pockets.

Tracking reconciliation

Campaign IDs and conversion events were reconciled between the advertiser tracker and the FroggyAds reporting view before budget changes were approved.

Controlled allocation

Budget changes were made in measured steps with rollback thresholds. Public case studies do not publish customer source IDs or unverified device-level combinations.

Creative process

Creative testing was managed as a controlled learning cycle

The original public draft included precise creative-level CTR figures that were not independently auditable. The revised case keeps the supportable operating method and removes those granular claims.

One variable at a time

Each test changed one meaningful element, such as the hook, image, call to action or landing-page transition, so the buyer could interpret the result.

Conversion quality first

Click response was treated as an early signal. A creative advanced only when downstream conversions and accepted customer events remained economically useful.

Separate test and scale pools

New variations stayed in a controlled test allocation while mature winners retained stable budgets. This reduced the risk of replacing a proven asset too quickly.

Document the decision

The buyer recorded what changed, the observation window and the next action. Public summaries describe the process without publishing unverifiable creative-level precision.

Campaign results

The reported totals and calculated efficiency metrics

Raw customer totals are paired with transparent calculations so the headline ROI can be evaluated in context.

These are customer-reported historical campaign results supplied to FroggyAds. The public summary is anonymized and has not been independently audited. Results are not a forecast, guarantee or universal benchmark — The reported totals and calculated efficiency metrics.

Clicks generated293,034403 active publishers
Reported conversions1,0770.37% calculated CVR
Cost per conversion$10.57$0.039 cost per click
Revenue efficiency2.96x$0.115 revenue per click

At the final reported totals, $11,387 in media spend generated $33,705 in gross revenue. Net profit was $22,318, which corresponds to the reported 196% ROI and a calculated 2.96x return on ad spend.

The 293,034 clicks produced 1,077 reported conversions. This creates a calculated conversion rate of 0.37%, a revenue-per-click figure of $0.115 and a revenue-per-conversion figure of $31.30.

These figures should be read as one historical campaign record. They show that the offer, format, market and optimization process worked together during the measured period. They do not establish a guaranteed rate card or a forecast for another advertiser.

The scale result also depended on the customer’s ability to recognize accepted value. For sweepstakes, that meant looking beyond the front-end event toward eligible entry, verified contactability and accepted downstream value. Without that connection, the same campaign could have appeared profitable while sending weak or ineligible outcomes downstream.

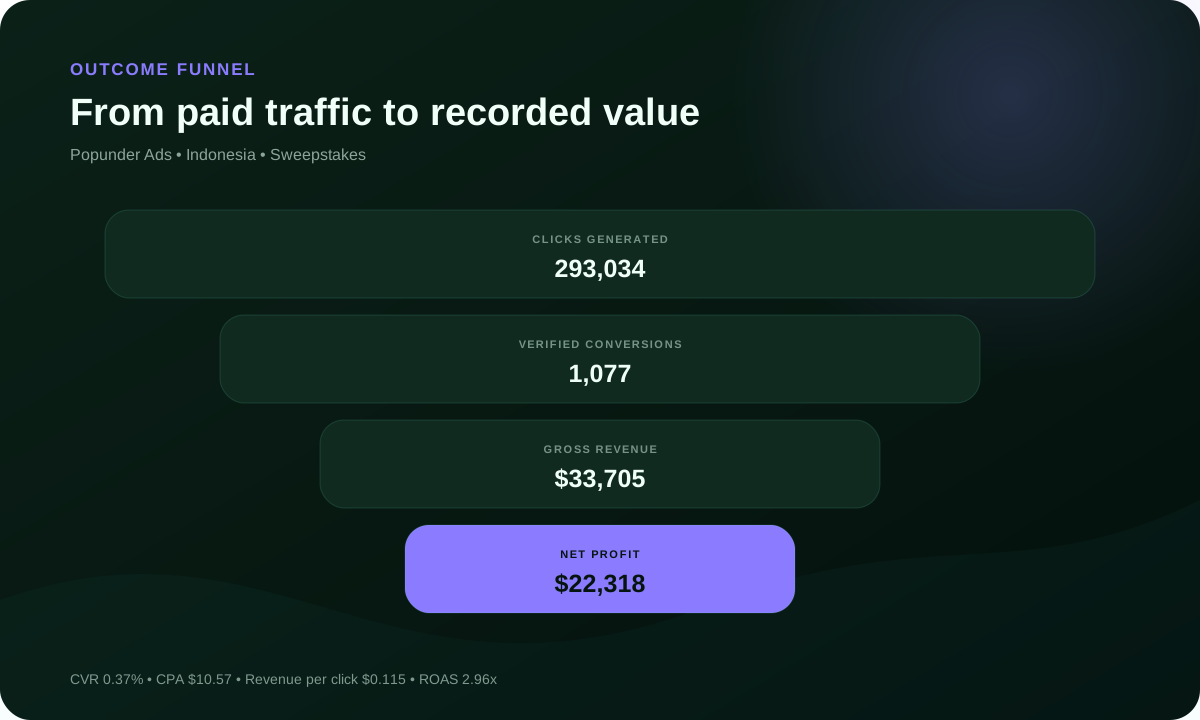
Outcome funnel for the Sweepstakes campaign

Reading the outcome funnel

The funnel connects the traffic total with the verified action and the financial result reported for the campaign.

  • 293,034 clicks produced 1,077 reported conversions.
  • Each verified conversion cost $10.57 in media spend.
  • Gross revenue averaged $31.30 per verified conversion.
  • Net profit was $22,318, equal to 196% of media spend.
MetricCalculated valueInterpretation
Cost per click$0.039Media spend divided by generated clicks
Conversion rate0.37%Reported conversions divided by clicks
Cost per conversion$10.57Media spend divided by reported conversions
Revenue per click$0.115Gross revenue divided by clicks
Revenue per conversion$31.30Gross revenue divided by reported conversions
Return on ad spend2.96xGross revenue divided by media spend
Scaling process

How the campaign moved from exploration to controlled budget growth

The customer used source separation, creative evidence, loss limits and rollback points instead of treating scale as a single budget increase.

Source exclusions were based on spend relative to the target acquisition cost and enough completed visits to support a decision. The team avoided judging the format from bounce rate alone.

The final scale plan balanced expansion with loss control. New inventory had room to learn, while proven segments retained separate bids and budgets.

The broad test campaign remained a discovery environment. Once a source and creative combination developed enough evidence, the buyer moved it into a more controlled structure with its own budget and bid logic. This protected proven segments from the volatility of continued exploration.

Stop rules were defined before each meaningful increase. If cost per accepted outcome moved outside the declared boundary, if source composition changed sharply or if downstream quality weakened, the campaign could return to the previous budget level rather than waiting for the full test budget to disappear.

The final 196% ROI reflected the complete measured period, including exploration and scaling. The customer did not remove the learning cost from the headline result. That makes the reported number more useful than a narrow screenshot of only the best-performing day.

A practical replication plan would begin with the decision logic, not the final bid. Another advertiser should recalculate conversion value, source maturity, creative requirements, legal eligibility and maximum acceptable loss before borrowing any part of the campaign structure.

Test

Launch enough source and creative breadth to learn, while keeping the maximum acceptable loss explicit.

Refine

Separate weak source, creative and destination combinations. Preserve the combinations that produce repeatable accepted outcomes.

Scale

Increase budget in measured steps and return to the previous level if cost, quality or source composition leaves the declared boundary.

Practical takeaways

What advertisers can learn from this Sweepstakes case

The transferable value is the decision process, not the assumption that another campaign will reproduce the same ROI.

What supported the historical result

  • One measurement path connected the source, creative, destination and accepted customer event.
  • Localization covered the complete post-click journey.
  • Source-level data remained visible during optimization.
  • Creative tests were interpreted with conversion and revenue data.
  • Budget increases were staged and reversible.

What must be recalculated for a new campaign

  • The accepted conversion and its real value.
  • The maturity window for delayed or adjusted outcomes.
  • The legal and policy eligibility of the offer and GEO.
  • The maximum test loss and rollback rule.
  • The source, device and landing-page mix available at launch.
Method and source note: Performance totals, campaign format, GEO and optimization observations come from a customer-provided FroggyAds campaign record in FROGGYADS SCALING BLUEPRINTS. Calculated metrics are derived from those totals. Customer identity, offer identity and dates are withheld. Results reflect one historical campaign and do not guarantee future performance.
Case study FAQ

Questions about the campaign

What result did this Sweepstakes campaign report?

The customer record reports $11,387 in ad spend, $33,705 in gross revenue and $22,318 in net profit, equal to 196% ROI for this campaign.

Which format was used in Indonesia?

The campaign used Popunder Ads. Popunder traffic supplied high-volume full-page visits that made landing-page speed, source controls and post-click qualification especially important.

How many clicks and conversions were recorded?

The record lists 293,034 clicks and 1,077 reported conversions, which produces a calculated conversion rate of 0.37%.

What was the calculated cost per conversion?

The reported spend divided by reported conversions produces a calculated cost per conversion of $10.57.

How was traffic quality evaluated?

The buyer reviewed source IDs and deeper outcomes such as eligible entry, verified contactability and accepted downstream value. Click volume alone did not determine whether a segment received more budget.

What did the detailed optimization log show?

The record included source-level CTR, CVR, CPC, device, browser and operating-system observations. This page summarizes those observations without exposing a private customer account.

How were creative tests interpreted?

The customer tested several message angles and compared the click-through response with reported conversions. A higher CTR was useful only when the downstream cost and accepted value remained inside the campaign boundary.

Are the visuals copied from a customer dashboard?

No. The graphics are original FroggyAds data visualizations built from the supplied campaign totals and optimization logs.

Does this case guarantee the same ROI for another advertiser?

No. Historical performance depends on offer economics, GEO, creative, landing page, tracking, bid, source mix, compliance and optimization decisions.

How can an advertiser test Popunder Ads with FroggyAds?

Define the accepted conversion, install reliable tracking, launch a controlled source sample, keep creative and source identifiers visible, and increase budget only after mature outcomes remain within the target cost boundary.

Advertisers & brands

Turn the next campaign into a measured growth story

Launch with a clear conversion boundary, source-level visibility and a plan for controlled optimization.

$50min deposit
7-daymoney-back
750+SSP sources
FroggyAds media buyer
FroggyAds support specialist
FroggyAds agency lead
FroggyAds advertiser
FroggyAds growth marketer
15,000+advertisers live
Adscore controlstraffic available throughout campaign workflows