Customer case study 33

How iGaming Direct Click Traffic Reached 156% ROI in Canada

An anonymized FroggyAds customer campaign turned $12,572 in media spend into $32,184 in gross revenue. This case study explains the setup, measurement chain, source controls and scaling decisions behind the reported result.

Customer identity is withheld for confidentiality. Figures and campaign settings are based on the customer-provided performance record.

Ad spend$12,572reported total
Gross revenue$32,1842.56x ROAS
Net profit$19,612after media spend
Total ROI+156%profit ÷ spend
Campaign performance summary for iGaming Direct Click Traffic in Canada

What does iGaming Direct Click Traffic in Canada: 156% ROI Case Study actually show?

Direct answer: iGaming Direct Click Traffic in Canada documents a reported campaign setup, its measured result, and the limits that affect transferability. We connect campaign overview, this case proves, and the acquisition challenge on this page. First, you should define the audience, desired outcome, and acceptance rule for iGaming Direct Click Traffic in Canada. Next, review campaign overview beside this case proves without changing the measurement window. Also, use the acquisition challenge as your stop, revise, or continue check. For context, this iGaming Direct Click Traffic in Canada review uses 3 source checks and 3 steps. However, the stated numbers are context, not a promised iGaming Direct Click Traffic in Canada outcome. Therefore, use the linked FTC guidance on online advertising reference to check the wider rule set. Finally, keep the iGaming Direct Click Traffic in Canada decision reversible until the evidence meets your stated rule.

Topic
iGaming Direct Click Traffic in Canada: 156% ROI Case Study
Primary decision
campaign overview compared with this case proves.
Required control
the acquisition challenge within the same audience, timeframe, and evidence boundary.
Decision pointVisible evidenceWhat you should verify
iGaming Direct Click Traffic in Canada: 156% ROI Case Study scopeThe page evaluates campaign overview, this case proves, and the acquisition challenge.Keep each criterion within the same stated audience and purpose.
Documented methodThe iGaming Direct Click Traffic in Canada review uses 3 source checks and 3 action steps.Confirm each check before recording a conclusion.
Review dateThe editorial review date is 2026-08-02.Recheck the iGaming Direct Click Traffic in Canada guidance when rules, inputs, or costs change.
Evidence table for iGaming Direct Click Traffic in Canada: 156% ROI Case Study. The counts describe this page's review method, not a promised market or campaign outcome.

How should you act on iGaming Direct Click Traffic in Canada: 156% ROI Case Study?

  1. Record the reported iGaming Direct Click Traffic in Canada audience, setup, period, and result exactly as stated.
  2. Separate the transferable method from conditions that your campaign cannot reproduce.
  3. Try a smaller validation test, then compare it with your own acceptance rule.

Use boundary: This iGaming Direct Click Traffic in Canada page supports a documented decision. It does not replace current platform rules, qualified advice, or evidence from your own implementation.

Decision record: igaming-direct-click-traffic-in-canada | continue | revise | stop

The strongest iGaming Direct Click Traffic in Canada conclusion is specific enough to test and limited enough to reverse safely.

FroggyAds Editorial Team

External reference: FTC guidance on online advertising and marketing. This source defines the wider context for iGaming Direct Click Traffic in Canada; FroggyAds statements remain company-supplied guidance.

Reviewed by the on . For iGaming Direct Click Traffic in Canada: 156% ROI Case Study, the review covered campaign overview, this case proves, and the acquisition challenge. The team reviews programmatic advertising, media buying, traffic-quality controls, and campaign measurement.

Campaign overview

This Canada campaign was designed around eligible registrations and deposit-stage acquisition for an iGaming advertiser. The customer used Direct Click Traffic on FroggyAds and recorded 137,821 delivered clicks, 769 reported conversions and $19,612 in net profit. The resulting 156% ROI is calculated as net profit divided by media spend.

Registration volume alone can hide age, eligibility, duplicate-account and deposit-quality problems. The buyer needed to optimize toward accepted downstream events.

The Canadian setup separated English and French audience paths where relevant and measured the final approved outcome rather than only front-end registrations.

The campaign was not judged from one front-end metric. The buyer linked click IDs, source IDs and conversion events so a strong headline could not hide weak customer value.

What this case proves

It shows that a controlled combination of offer fit, localization, conversion tracking and source-level optimization can produce a profitable campaign. It does not establish a guaranteed benchmark for every igaming advertiser.

The acquisition challenge

The operational challenge was not simply to buy more canadian traffic. It was to acquire enough signal to identify which sources, devices and messages could produce eligible registration, verified account and accepted deposit-stage value without letting the test budget expand faster than the evidence.

The customer began with a clear economic boundary. The final campaign total implies a cost per verified conversion of $16.35 and revenue per verified conversion of $41.85. Those values gave the buyer a practical frame for deciding whether a source deserved more exposure, needed a bid adjustment or should be removed from the test.

Only licensed and eligible campaigns should run. Age gating, responsible-gaming language, GEO restrictions and local rules must be respected.

Campaign setup and targeting

Direct Click reduced creative layers and placed more responsibility on offer selection, routing, page speed and the first seconds of the destination experience.

The buyer used tightly controlled destination variants, preserved source and click identifiers through redirects and removed extra steps that did not improve qualification.

The source report lists 719 active publisher zones and a 75.2% bid win rate. Those figures describe the breadth of available delivery, but they were not treated as quality scores. Each source still had to earn budget through conversion and downstream outcome data.

  • GEO: Canada (CA)
  • Format: Direct Click Traffic
  • Primary objective: User Acquisition
  • Optimization ID: IGA-CA-7733012572
  • Reported source coverage: 719 active publisher zones
  • Bid win rate: 75.2%

Creative and landing-page strategy

The campaign made the product category and eligibility clear, avoided implying guaranteed winnings and kept the registration path consistent with the ad.

Because the destination carried the full message, the first screen made the value proposition, eligibility and next action explicit.

Creative testing focused on one interpretable change at a time. A new message, image or destination was given its own ID so the winning reason remained visible.

The campaign record describes multiple creative and pre-landing variants rather than one untested message. The practical value of that approach was not variety by itself. It gave the buyer enough controlled combinations to see whether a result followed the message, the publisher source or the destination experience.

Tracking and data quality

The customer used server-to-server conversion feedback and retained source identifiers through the click path. That reduced dependence on browser-only measurement and made it possible to connect a conversion with the campaign, creative and publisher zone that produced it.

Page speed was treated as part of the acquisition system. The source material describes a geographically distributed setup and a target time to first byte below 120 milliseconds. The larger lesson is that redirect latency, heavy scripts and unstable mobile layouts can create apparent traffic-quality problems that actually begin on the advertiser side.

The campaign also used additional traffic-quality checks before optimization decisions were made. FroggyAds traffic-quality controls can reduce exposure to invalid activity, but no control eliminates every risk. The customer still reconciled the reported conversions with the accepted business event.

Optimization sequence

The team evaluated direct-click placements by accepted conversion cost, not raw visit volume. High-performing sources were isolated so budget increases did not reopen every test placement.

The customer report describes a loss-control rule at the source level: a placement that consumed materially more than the target acquisition cost without a verified conversion was removed from the active test. Sources that showed repeatable conversion momentum were isolated into dedicated scale groups rather than left inside the original broad campaign.

Dayparting and operating-system segmentation were introduced only after enough data existed to identify a pattern. This mattered because a short burst of conversions can be caused by reporting delay or source mix. The buyer compared mature cohorts before concentrating spend in stronger time windows and device groups.

Scaling followed measured steps rather than one large budget jump. After each increase, the team checked whether source composition, conversion delay and accepted value remained comparable to the prior level.

Campaign results

The reported numbers and what they mean

Raw totals are paired with calculated efficiency metrics so the result can be evaluated beyond the headline ROI.

These are customer-reported historical campaign results supplied to FroggyAds. The public summary is anonymized and has not been independently audited. Results are not a forecast, guarantee or universal benchmark — The reported numbers and what they mean.

Clicks delivered137,821719 active publisher zones
Reported conversions7690.56% calculated CVR
Cost per conversion$16.35$0.091 cost per click
Revenue efficiency2.56x$0.234 revenue per click
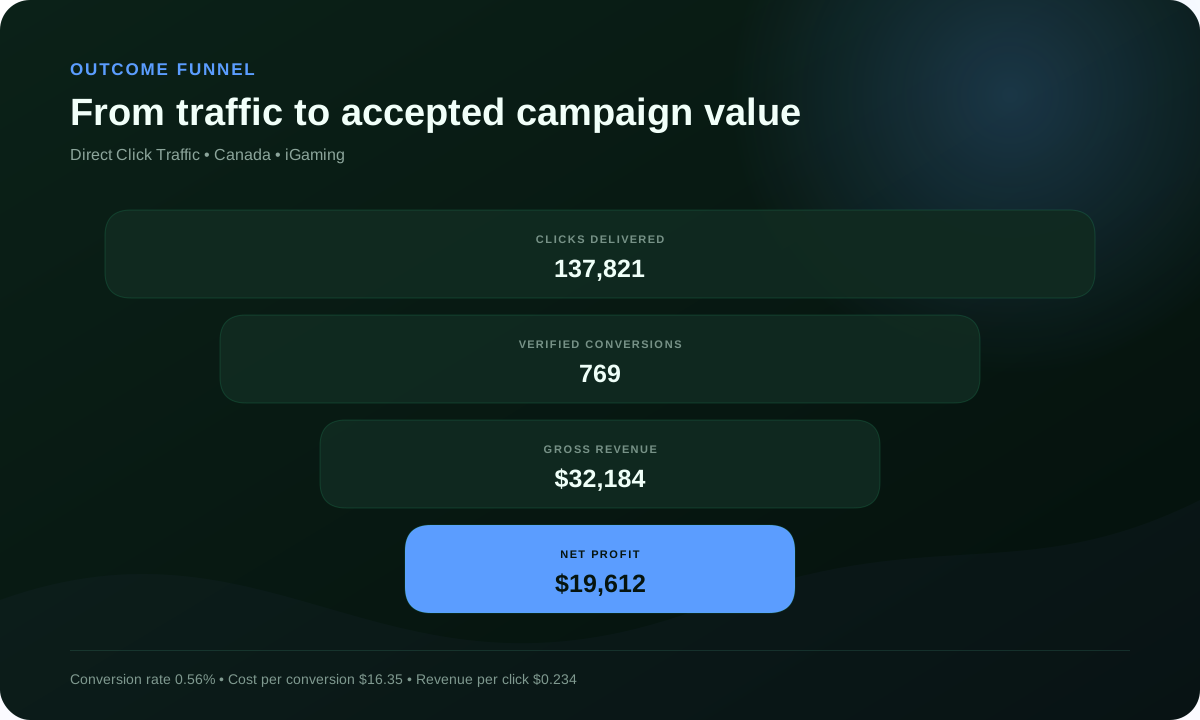
Outcome funnel for the iGaming campaign

Reading the funnel

A high click count was useful only because the campaign retained enough source and conversion detail to trace the value created after the click.

  • 137,821 clicks produced 769 reported conversions.
  • Each verified conversion cost $16.35 in media spend.
  • Gross revenue averaged $41.85 per verified conversion.
  • Net profit was $19,612, equal to 156% of media spend.
MetricCalculated valueInterpretation
Cost per click$0.091Spend divided by delivered clicks
Conversion rate0.56%Reported conversions divided by clicks
Cost per conversion$16.35Spend divided by reported conversions
Revenue per click$0.234Gross revenue divided by clicks
Revenue per conversion$41.85Gross revenue divided by reported conversions
Return on ad spend2.56xGross revenue divided by spend
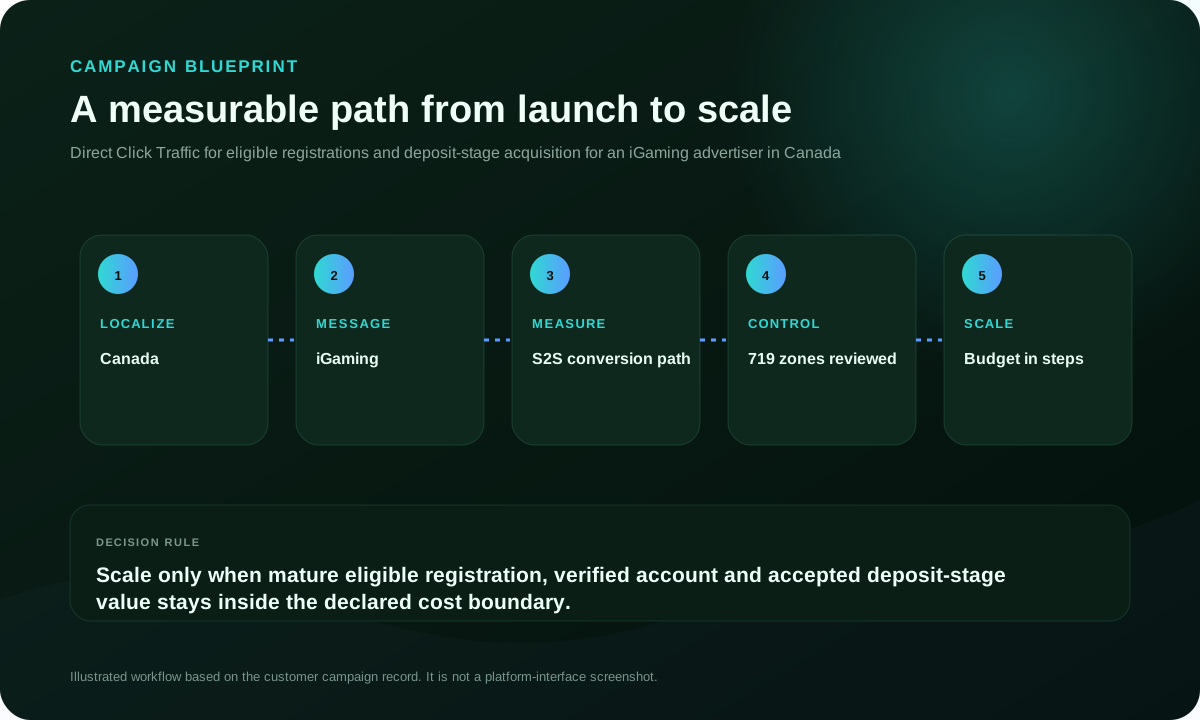
Execution blueprint

How the customer moved from test traffic to controlled scale

The graphic summarizes the operating sequence described in the campaign report. It is a workflow visualization, not a private dashboard screenshot.

Campaign optimization blueprint for Direct Click Traffic

Test

Launch enough source and creative breadth to learn, while keeping the maximum acceptable loss explicit.

Refine

Separate weak creative, landing and source combinations. Preserve the combinations that produce repeatable reported conversions.

Scale

Increase budget in measured steps and return to the previous level if cost, quality or source composition leaves the declared boundary.

Practical takeaways

What advertisers can apply from this iGaming case

The transferable value is the decision process, not the assumption that another campaign will reproduce the same ROI.

What worked in this campaign

  • One measurable conversion path connected the ad, source, landing page and customer outcome.
  • Localization covered the complete experience, not only the headline.
  • Creative variants were traceable and interpreted together with source performance.
  • Loss limits were set before source exclusions and scale decisions.
  • Budget increases were staged and reversible.

What to validate before copying the approach

  • Your offer and campaign must be eligible in the target market.
  • Your conversion value and maturity window may differ from this case.
  • Your landing page, device mix and source prices will change the economics.
  • Traffic-quality controls reduce risk but do not replace reconciliation.
  • Scale only when accepted downstream value remains inside your cost boundary.
Method and source note: The performance totals, campaign format, GEO and optimization details on this page come from a customer-provided FroggyAds campaign record. Calculated metrics are derived from those totals. Customer name, offer identity and campaign dates are withheld for confidentiality. Results reflect one campaign and do not guarantee future performance.
Case study FAQ

Questions about the campaign

What was the main result of this iGaming case study?

The customer-reported campaign spent $12,572, generated $32,184 in gross revenue and $19,612 in net profit, equal to 156% ROI for this campaign.

Which ad format was used in Canada?

The campaign used Direct Click Traffic. Direct Click reduced creative layers and placed more responsibility on offer selection, routing, page speed and the first seconds of the destination experience.

How many clicks and conversions were recorded?

The source report lists 137,821 clicks and 769 reported conversions, for a calculated conversion rate of 0.56%.

What was the calculated cost per conversion?

Based on the reported spend and reported conversions, the calculated cost per conversion was $16.35.

How was campaign quality evaluated?

The practical quality boundary was deeper than the click. The buyer reviewed eligible registration, verified account and accepted deposit-stage value and used source-level identifiers to connect traffic with downstream outcomes.

What role did localization play?
How did the buyer optimize publisher sources?

The campaign record describes source-level review, removal of placements that exceeded the declared acquisition-cost boundary and separate scaling of sources that produced repeatable conversions. The campaign evaluated 719 active publisher zones.

Were the graphics on this page copied from a platform dashboard?

No. The visuals are original FroggyAds data visualizations created from the customer-provided campaign totals. They are not presented as screenshots of a private customer account.

Does this result guarantee the same ROI for another advertiser?

No. This is a historical campaign result. Performance depends on the offer, market, creative, landing page, tracking, bid, competition, compliance and optimization decisions.

How can an advertiser test Direct Click Traffic with FroggyAds?

Create an advertiser account, define the accepted conversion and cost boundary, install reliable conversion tracking, launch a controlled source sample and increase budget only after mature outcomes remain within the target.

Advertisers & brands

Turn the next campaign into a measured growth story

Launch with a clear conversion boundary, source-level visibility and a plan for controlled optimization.

$50min deposit
7-daymoney-back
750+SSP sources
FroggyAds media buyer
FroggyAds support specialist
FroggyAds agency lead
FroggyAds advertiser
FroggyAds growth marketer
15,000+advertisers live
Adscore controlstraffic available throughout campaign workflows