
Banner Traffic Cost: Forecast, Test and Control Spend
Use banner traffic cost as a chain of denominators: impressions, clicks, usable visits and mature accepted outcomes. FroggyAds gives you a self-serve campaign cell for targeted traffic, bids, budgets and source review. Your economics determine which cost layer releases the next unit of spend.
What should a banner traffic cost review accomplish?
The review should explain what you bought, what reached the destination, what became accepted value and which campaign action follows. It should not collapse every layer into one blended cost. A CPM, CPC, landing-session cost and accepted acquisition cost answer different questions.
Define the decision before the forecast. A launch forecast estimates an affordable test boundary. A source review compares traffic cells after comparable maturity. A scale review asks whether the added cohort preserved accepted economics. Each decision needs its own denominator, observation window and owner.
Keep source identity, creative and destination versions with the result. A low account-wide average can hide a placement that sends unusable visits or a creative that attracts the wrong expectation. The purpose of measurement is to locate the next controllable change.
The review ends with one action: keep the cell, pause a source, repair the journey, test a new creative, wait for maturity or expand one variable. Record the evidence and rollback so the next result remains attributable to the exact cohort, date and operating condition.
Maintain a cost dictionary beside the decision record. For each reported figure, define its numerator, denominator, eligible traffic, currency, time zone, attribution rule, invalid-activity treatment and maturity date. This prevents teams from comparing a platform click total with an analytics session total or a preliminary event with an accepted outcome. The dictionary also makes a handoff faster: a new operator can see which event changed and which campaign setting remains controlled. When the definition changes, close the earlier cohort and label the new one instead of rewriting historical results.
Which six layers keep banner traffic cost interpretable?
First, record the buying unit and eligible media cost. Second, retain impressions and the quality status used by your reporting. Third, preserve click identifiers. Fourth, verify usable landing sessions. Fifth, define the mature accepted event. Sixth, join the event back to source, placement, device and creative.
Assign an owner and failure condition to every layer. Media operations owns campaign settings and delivery evidence. The destination owner keeps the page available and consistent with the banner. Analytics owns the identifier join. The commercial owner defines accepted value and the budget rule.
Use immediate stops for invalid setup: broken links, misleading claims, unavailable pages and lost identifiers. Use maturity-based stops for economics. This prevents a source from being judged before outcomes settle while avoiding needless spend on a journey that is already invalid.
| Layer | Evidence | Decision |
|---|---|---|
| Media | Spend, impressions and clicks | Check delivery and response |
| Journey | Click-to-arrival join and page events | Repair lost or unsuitable visits |
| Business | Mature accepted outcomes | Allocate by quality-adjusted value |
How do you test one accountable banner journey?
Start with one banner promise, compatible placement context and destination release. Define the audience and the business event before delivery. Keep the campaign small enough to inspect source, device and placement evidence without blending several unanswered questions.
Set an explicit media ceiling and a journey stop rule. The ceiling limits exposure while the banner and landing path are being validated. If a click does not create a usable landing session or the page does not continue the promise, repair that handoff before increasing volume.
Measure impressions, clicks, usable visits and mature accepted outcomes as separate cohorts. Compare each source under the same attribution and validation rules. When the cell is ready, start a FroggyAds banner traffic test.
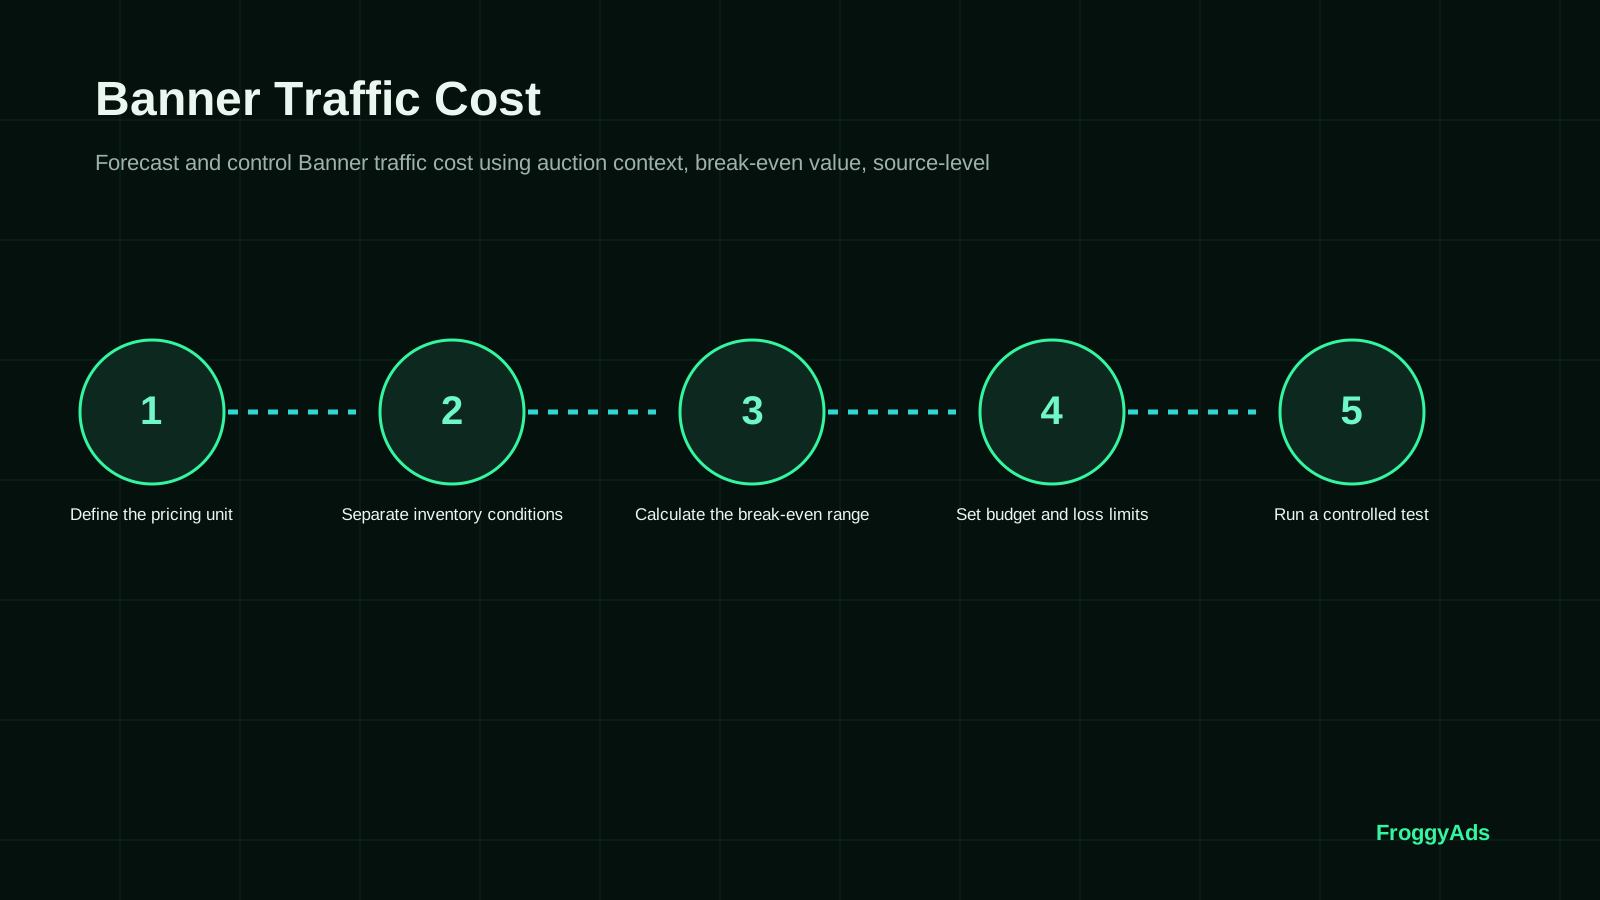
What is a practical seven-step banner traffic cost process?
Define the buying and decision units
Name the CPM or CPC media view and the later cost per usable visit or accepted event. Keep them separate.
Map the banner journey
Record creative, size, placement context, click route, destination and accepted outcome.
Preserve identifiers
Carry campaign, creative and source values through the landing session and outcome record.
Set a learning ceiling
Choose a maximum exposure, review time and immediate failure stops from your economics.
Launch one controlled cell
Keep market, device, creative and destination assumptions narrow enough to interpret.
Reconcile mature evidence
Separate invalid, rejected, duplicate, reversed and unresolved records before calculating business cost.
Release one next action
Keep, repair, pause or expand one variable with a written owner and rollback.
Which banner traffic belongs in the cost comparison?
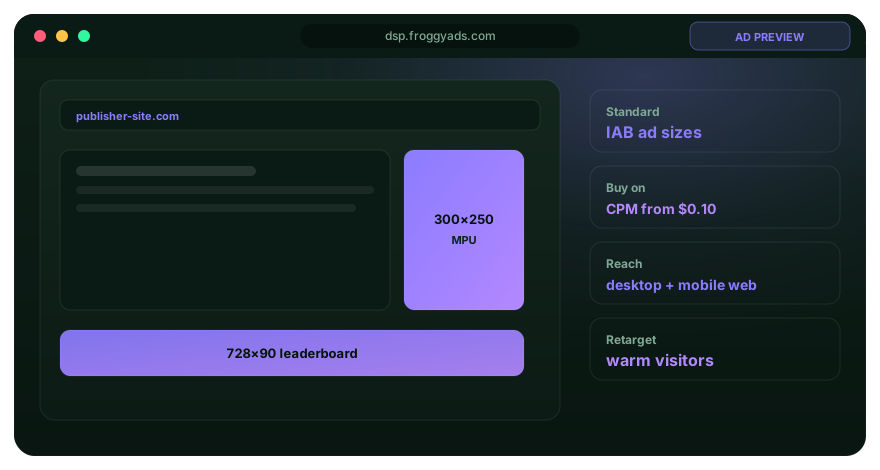
Choose inventory that matches the audience, market, device and page experience the offer can serve. Keep banner size and placement context visible because a user who encounters a prominent in-content unit may behave differently from one who sees a smaller peripheral placement.
Do not assume that broader reach creates cheaper useful acquisition. A low impression price can still produce weak attention, accidental clicks or unsuitable visits. Use source and placement records to see where the denominator changes between served media and usable destination sessions.
Split cells when a material condition changes: market, device, creative, destination, audience or acceptance rule. If you combine them, the cheapest large cohort can subsidise a smaller weak one and prevent a precise pause decision.
When the comparison is defined, create your FroggyAds account and use a separately labelled campaign for the banner question.
How do you forecast banner cost without inventing a price?
Build a range from your campaign inputs instead of publishing an unsupported universal rate. State the assumed CPM or CPC, eligible impressions or clicks, click-through or arrival rate, accepted outcome rate and observation window. Then show how the output changes when each assumption moves.
Hypothetical CPM example: USD 200 at a USD 2 CPM buys 100,000 impressions. If 600 clicks are recorded, the derived CPC is about USD 0.33. If 510 usable sessions arrive, their cost is about USD 0.39. If 15 outcomes mature as accepted, media cost per accepted outcome is about USD 13.33.
The example explains the denominator chain; it is not a FroggyAds price, benchmark or prediction. Replace every input with current campaign data. Show the click-to-arrival loss and unresolved outcomes rather than hiding them inside a final CPA.
Use a sensitivity table for the decision. A forecast that works only under the most optimistic response and acceptance assumptions deserves a smaller learning ceiling. A robust test boundary should tolerate ordinary variation without risking more than the business can support.
Add a break-even view without presenting it as a guaranteed bid. Start from the maximum cost the business can support for one mature accepted outcome. Multiply that amount by a conservative accepted-outcome rate to estimate the corresponding ceiling per usable visit, then apply the measured click-to-session rate to understand the click layer. Finally, use the observed click-through rate to translate the constraint into impression economics. Every step compounds uncertainty, so show a range and the source of each input. The purpose is to cap the experiment, not to predict the auction or promise profitability.
How should creative, format and destination stay connected?
Describe the real value and next step in the banner without implying guaranteed eligibility or outcome. The landing page should repeat the promise, clarify conditions and make the required action understandable on the intended device.
Version the banner, size and destination. A new creative can change response, while a page revision can change arrival quality and accepted outcomes. Begin a new evidence period when both change together or label the result as confounded.
Use format and placement evidence to interpret the cost chain. Compare the same offer and acceptance rule across clearly identified cells. Do not transfer a conclusion from one banner size or page context to every display placement.
How do you move from the cost model to live delivery?
Confirm the destination, identifiers, banner version, selected inventory, buying model, learning ceiling, accepted event and review window. Run a controlled click and verify it appears as a usable session with the expected campaign and source values.
Launch the smallest cell that can answer the immediate question. The first stage may verify delivery and tracking. A later stage may evaluate accepted economics after the event matures. Do not spend through the full ceiling just because the final metric is delayed.
Watch early diagnostics without turning them into a scale decision. Impressions and clicks reveal delivery and response. Sessions reveal route continuity. Only mature accepted outcomes answer the later commercial cost question.
Use FroggyAds for the controlled banner campaign when the journey and decision rule are ready.
Which journey checks protect the banner cost calculation?
Check message continuity, destination availability, mobile rendering, page speed, form behaviour, confirmation and event firing. A cheap media cell can appear expensive at the business layer when the destination prevents suitable users from completing the action.
Compare clicks with actual arrivals. Investigate redirects, blocked resources, accidental interaction and measurement differences. Treat the gap as journey evidence rather than automatically calling it invalid traffic or normal loss.
Make important conditions visible before the user commits. A banner that attracts people with a promise the page narrows or contradicts may create a strong click rate and a weak accepted result. That is a message-system failure, not a reason to chase cheaper clicks.
Preserve a control version. When response weakens, test one message or visual element while holding the destination and audience stable. If the source mix changed simultaneously, report the limitation before crediting the creative.
How should you respond when banner cost metrics disagree?
Low CPM, weak arrival quality
Inspect placement, device and click-to-session loss. Keep the low media price visible, but do not scale until the journey explains why visits fail.
Higher CPC, stronger accepted value
Compare mature cost per accepted outcome and contribution. A more expensive click can be the better business choice when the cohort produces usable value.
Strong clicks, weak conversion start
Review message continuity, offer clarity and page usability. The banner may be attracting curiosity the destination cannot convert.
Strong initial events, high rejection
Use the rejection taxonomy and source join. Recompute cost with mature accepted events before allocating more spend.
Which mistakes make banner traffic cost look better than it is?
Avoid an unnamed denominator, a blended account average, mixed maturity windows, missing source IDs, silent destination changes, preliminary events treated as accepted value, unresolved records excluded from the report and production or operating costs hidden from the broader contribution view.
Do not rank a fresh cell against a mature control. Give outcomes equal time to be rejected, duplicated or reversed. Show the observation dates and status counts so the reviewer can see whether the comparison is ready.
Do not use a viewable impression, click and accepted outcome as interchangeable conversions. Each event has a place in the funnel. A strong early rate and weak later rate locate a handoff that should be repaired.
Do not respond to every weak result by changing bid, audience, banner and landing page together. Select the earliest broken layer and change one material input. The following result should answer a question, not create another blended mystery.
Avoid survivor bias in source reports. A source paused early may have fewer mature records than a source allowed to run longer, while a winning-looking source may benefit from a stronger creative or later destination release. Keep exposure dates, pause rules and unresolved statuses beside the comparison. Review the marginal cohort created after any increase instead of relying on the lifetime average. If the new cohort weakens while the historical control remains strong, roll back the increase and investigate the added placements before altering the offer or page.
How do you turn instrumentation into a repeatable cost decision?
Days 1–3: verify campaign, creative, source, click and destination identifiers; confirm the accepted event and status window. Days 4–10: run bounded cells and check delivery, arrival and obvious journey failures.
Days 11–20: reconcile usable sessions, preliminary outcomes, rejections, duplicates and unresolved records by source. Repair one handoff where the evidence is clearest. Days 21–30: compare mature cohorts, document limitations and release one next action.
Treat any expansion as a new marginal cohort. Keep the previous baseline, use the same acceptance rule and roll back when the added delivery weakens mature economics. Start your next FroggyAds campaign only with owners and stop conditions in place.
Which sources support the banner cost operating model?
Use first-party campaign records for your actual prices and outcomes. These external sources provide general protocol, measurement, format and experience context; they do not prove a FroggyAds result.
- FroggyAds traffic sources for the advertiser-side source planning path.
- IAB Tech Lab OpenRTB 2.6 for auction and impression context.
- Google Ads invalid traffic guidance for general measurement context.
- FroggyAds ad formats for format selection.
- Coalition for Better Ads standards for general ad-experience context.
Record the source version and limitation used for a material decision. Current campaign and account evidence remains the authority for the media cell.
Banner traffic cost FAQ
Use each answer with the exact campaign cell, denominator and maturity window you are reviewing.
What does banner traffic cost measure?
It can describe several layers. CPM measures media cost per thousand impressions, CPC measures media cost per click, cost per qualified visit measures usable arrivals, and accepted acquisition cost measures a later business outcome. Name the denominator every time.
Is there one standard banner traffic price?
No responsible universal price applies to every market, audience, device, placement, format and auction. Use the current campaign setup and actual delivery to build a forecast range, then replace assumptions with observed evidence.
How do I calculate CPM from spend?
Divide media spend by served impressions and multiply by 1,000. If USD 120 buys 80,000 impressions, the CPM is USD 1.50. This is a hypothetical calculation, not a FroggyAds price or forecast.
How do I calculate CPC from a CPM campaign?
Divide media spend by recorded clicks for the same cell and period. Keep invalid activity and missing-arrival checks visible. The derived CPC explains response to paid impressions; it does not establish accepted business value.
Why can click cost and landing-session cost differ?
Some clicks may not produce a usable page session because of redirects, page availability, measurement differences or accidental interaction. Compare click identifiers with destination arrivals before treating every click as a qualified visit.
Which banner dimensions should be separated?
Split publisher or source, placement, size, page position, device, market, creative and audience when they can change the user context or result. Keep the same acceptance rule and maturity window for the comparison.
How large should a banner traffic test be?
Set a learning ceiling from your own economics, measurement delay and ability to review sources. The test should be large enough to answer one decision and small enough to pause or roll back when the journey fails.
Can cheap banner traffic guarantee low acquisition cost?
No. A low delivery or click cost may still produce poor landing sessions or few accepted outcomes. Paid traffic cannot guarantee leads, sales, revenue, profit or organic rankings.
When should a banner source be paused?
Pause immediately for broken destinations, misleading creative or lost identifiers. Apply economic stop rules after comparable cohorts have matured. Record the source, evidence, time and restart condition.
When is banner traffic ready to scale?
Scale when the message and destination remain coherent, source identifiers join to mature outcomes, quality patterns are explainable and the marginal cohort stays inside your rule. Increase one variable and keep a rollback.
Continue the paid traffic cost workflow
Choose the next page by format and decision instead of applying one banner conclusion to every type of paid traffic.
Display traffic cost
Review the wider display buying and outcome chain.
Interstitial traffic cost
Measure a full-screen placement context separately.
Native traffic cost
Connect content-like placement context to the destination.
Popunder traffic cost
Keep the separate browsing context visible in the cost review.
Turn banner traffic cost into a controlled campaign test
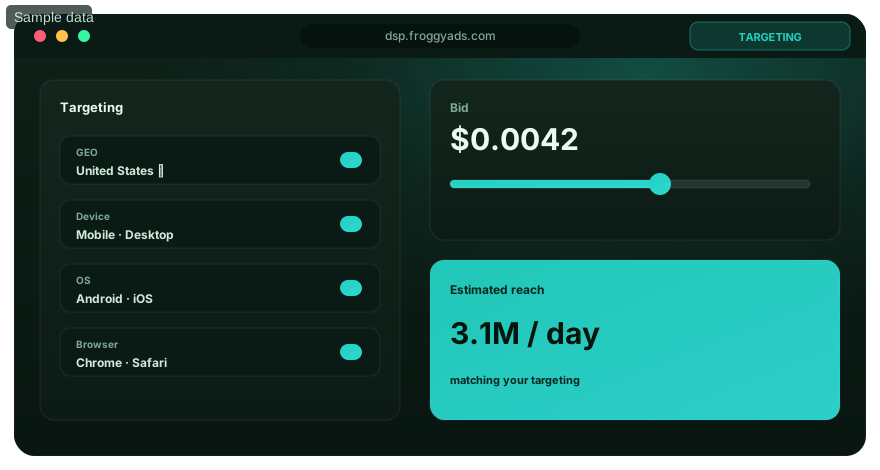
Name the media unit, usable-session rule, mature accepted event, learning ceiling and rollback. Then use FroggyAds targeting, bid, budget and source controls for one separately measured cell.
Which buyer task belongs to this banner traffic cost page?
Use this URL to forecast, measure and control the cost chain for banner traffic. It owns the distinction between media price, click response, usable landing sessions and mature accepted outcomes, plus the source-level decision that follows.
For regional supply planning, continue to global banner traffic. Keep the market and source evidence in the new campaign cell rather than treating a general cost model as a current quote.
The buyer task is complete when the next allocation has a denominator, campaign cohort, evidence window, owner and rollback. Until then, keep the learning ceiling bounded and avoid a universal price claim.
What matters first when you estimate banner traffic cost?
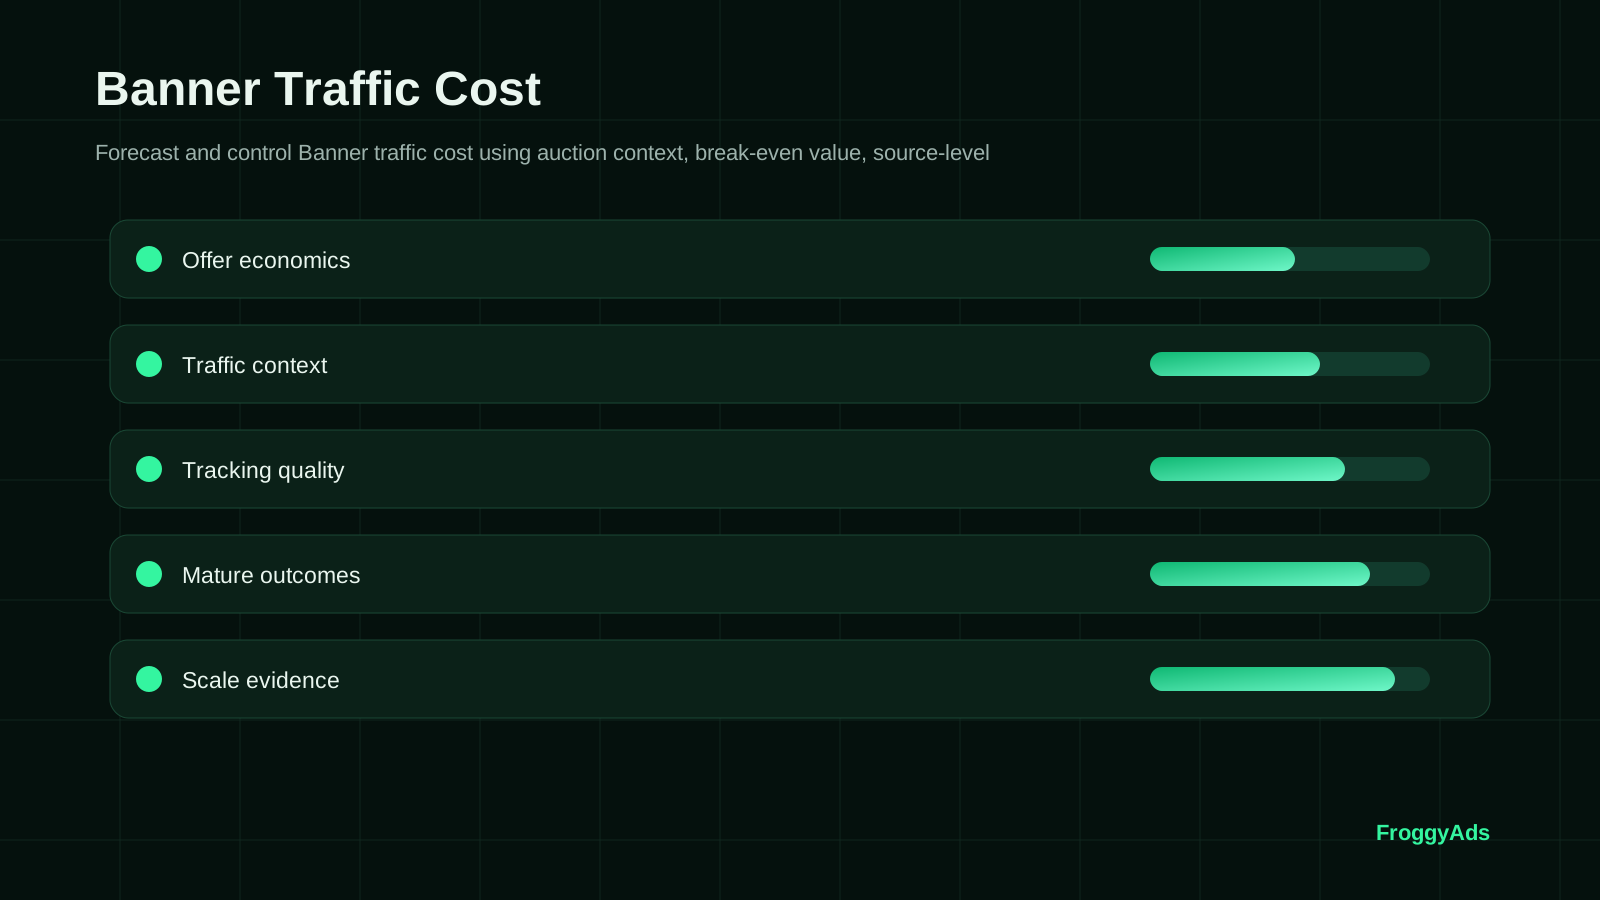
Choose the denominator that matches the decision. Use CPM for impression delivery, CPC for click response, cost per usable visit for the destination handoff and cost per mature accepted outcome for the commercial result. Keep all four visible when they diagnose different layers.
Use current campaign evidence rather than a generic rate. Split source, placement, size, device, market, creative and audience where they change the journey. Apply one acceptance rule and maturity window before ranking cells.
When the banner, destination, tracking and learning ceiling are ready, choose FroggyAds for your next banner traffic campaign. Expand only when the added cohort preserves explainable, quality-adjusted value.