
B2B CAMPAIGN REPORTING
B2B Marketing Dashboard: Connect Traffic, Sales Acceptance and Pipeline
Author: FroggyAds. A B2B marketing dashboard brings campaign delivery, lead quality, sales follow-up and pipeline progress into one decision view. It should help you decide where to spend, what to repair and which prospects need attention. At FroggyAds, we recommend connecting your paid-traffic test to the business outcomes your team can verify. Separate a submitted form from a sales-accepted inquiry, an opportunity from revenue, and a recent campaign from a mature cohort. Those distinctions make your dashboard useful when the sales cycle lasts longer than the advertising test.
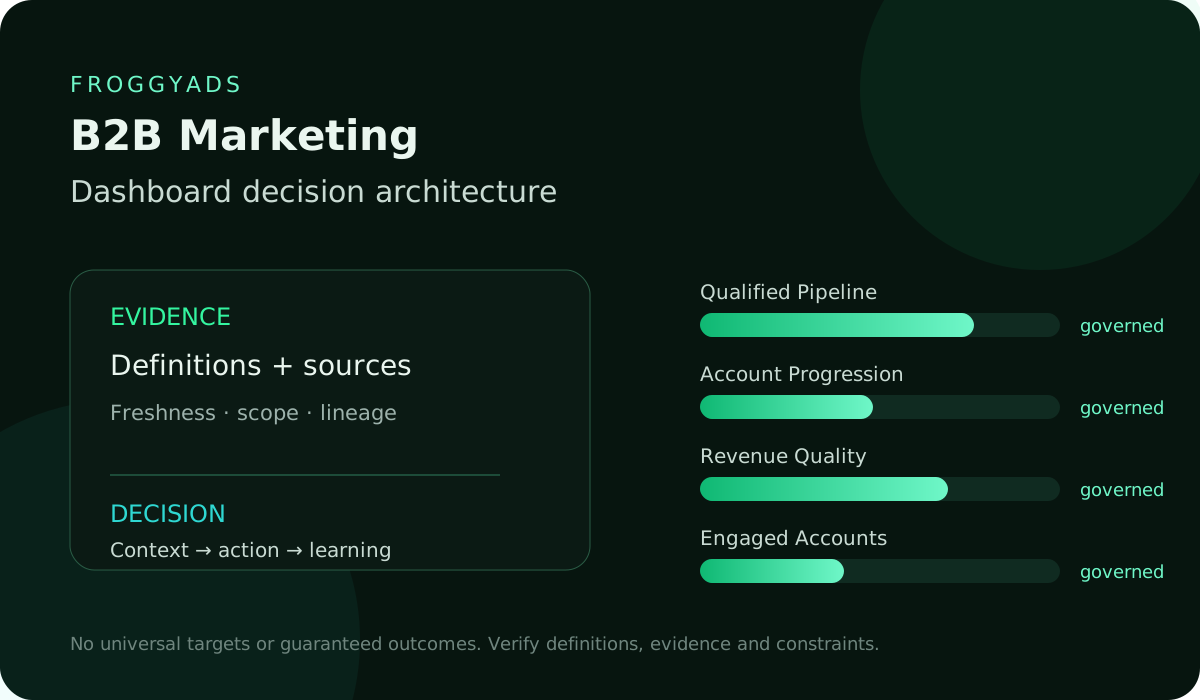
What should your B2B marketing dashboard help you decide?
Our approach starts with the next commercial decision. You may need more relevant inquiries, a clearer landing-page promise or faster sales follow-up. Choose FroggyAds for a self-service traffic campaign with an offer, destination and measurement plan you control. Your dashboard then shows how that campaign contributes to the business process. Keep campaign delivery, customer qualification and sales outcomes clearly labelled so each team can act on the evidence it owns.
| Dashboard focus | What the view shows |
|---|---|
| Campaign delivery | Campaign scope, delivered interactions and media expenditure. |
| Business inquiries | Submitted, valid, duplicate and pending inquiry records. |
| Sales progress | Completed reviews, held meetings and opportunity status. |
Before you launch, agree what makes an inquiry useful: the markets you serve, the need your offer addresses, the information sales requires and the review deadline. Record the campaign identifier in your permitted measurement setup and test that it survives the journey to the form. Create your free FroggyAds account with this plan ready. A short working record is enough to begin; add reporting complexity when it answers a real buying decision. Google Analytics documentation.
DIRECT ANSWER
Start with the buying decision
Begin with a question that changes an action: should we keep this campaign running, revise the offer page or clear the sales backlog? Name the decision owner and the evidence they need. A media buyer needs current spending and delivery; a sales manager needs the age and status of assigned inquiries. Give each person a useful view of the same campaign rather than asking every chart to serve every role.
Start with the decision. Identify the campaign question before choosing the chart.
01
DECISION OWNERSHIP
Give marketing and sales clear responsibilities
Agree who can change the campaign
Marketing should own the acquisition question and the offer presented to the visitor. Sales should own its documented acceptance and follow-up decisions. Finance should confirm which costs and commercial amounts belong in an economic comparison. Write down who may edit a FroggyAds campaign and who approves a larger allocation. This keeps the dashboard connected to practical authority when several people or an agency share the work.
Choose a useful reporting level
Select a reporting level that your data can support. One form submission, one person, one company and one opportunity are different units. Several contacts from a company can become one opportunity; one contact can ask about more than one project. Define those relationships in your own business records before adding their totals together. Keep ambiguous matches visible so a tidy chart cannot turn uncertain attribution into an apparent sale.
Separate delivery checks from sales-cycle reviews
Fast delivery checks help you manage current expenditure and destination availability. Sales acceptance and opportunity creation often need a longer observation period. Show both timeframes. A campaign launched yesterday can be assessed for working links and usable visits while its sales result remains pending. We recommend using current delivery evidence to manage the test and sufficiently reviewed business records to judge the quality of its inquiries.
Show when each source was last complete
Source timestamps should describe the underlying records, not just the moment the dashboard refreshed. Your campaign report might be current while CRM updates are waiting for review. Put a last-complete time beside each important source and name the person who can resolve delays. Where sales is still processing a cohort, display the outstanding count. Avoid comparing recent advertising spend with opportunities accumulated across an unrelated period.
Assign the campaign action. State who approves, applies and reviews the change.
02
COMPARABLE COHORTS
Compare B2B campaign cohorts fairly
Cohorts group prospects by a meaningful starting event, such as the week they first submitted an inquiry from a defined campaign. Follow that group through review and opportunity stages. A separate workload view can show what sales needs to process today. Both views matter: the cohort supports a fair campaign comparison, while the workload view shows whether the team can handle the demand you are buying.
Budget decisions become clearer when the dashboard states the campaign, acquisition dates, review cutoff and cost scope together. Compare cohorts at similar ages or clearly label their differences. A younger campaign may have fewer opportunities simply because fewer prospects have reached a sales conversation. Keep its result provisional until the agreed review point, then compare it with a similarly assessed group rather than an older campaign total.
Campaign context should travel with the figures. Preserve the offer, creative version, landing page, market, ad format and relevant delivery settings in your reporting record. Record material changes with their dates. These details help you identify what changed between two groups of inquiries. With FroggyAds, use that history to choose a specific next campaign test, while your own customer records establish whether the resulting inquiries met your business criteria.
Broken routes deserve an immediate response. Check that the destination opens, the form works and the information needed for your permitted attribution setup reaches the business record. If delivered interactions remain stable but usable sessions fall, inspect the route before drawing an audience conclusion. A successful test submission should reach the expected queue with the expected campaign context. Retain the test result and correct any missing handoff.
Compare like with like. Show acquisition dates and the business-review cutoff.
03
VALID BUSINESS INQUIRIES
Define valid business inquiries before judging volume
Every submission should enter a visible classification process. Distinguish a new business inquiry from a duplicate, spam record, existing-customer request or incomplete submission. Define the treatment that fits your offer and keep the reason for exclusions. A high submission count can be useful for diagnosing the form, but your buying decision needs to know how many inquiries sales can reasonably assess for the service you actually provide.
Validation rules work best when they are specific and reviewable. State the required contact information, supported markets and relevant customer need. Explain how corrections or duplicate submissions are handled. Keep the original submitted count alongside the validated count so a stricter rule does not appear to be a sudden improvement in advertising. Apply a changed rule consistently or label the break in comparability.
Backlogs can make a promising campaign look weak or a weak campaign look better than it is. Show how many inquiries are waiting, how old they are and who owns the next action. Distinguish missing information from uncompleted review. When the queue is growing, address that operational issue before buying a larger volume that the business cannot assess or follow up promptly.
Incomplete review calls for a bounded decision. Keep useful delivery checks running, show the outstanding business records and choose the next spend level with that uncertainty visible. We can help you structure the next traffic test around a prepared offer; your team should supply the qualification decisions that make the test commercially meaningful. Update the dashboard after the agreed review window rather than silently recasting pending prospects as unsuccessful.
Define useful inquiries. Keep exclusions and pending validation visible.
04
SALES ACCEPTANCE
Measure sales acceptance and follow-up separately
Sales acceptance should mean that an inquiry meets your agreed entry rule for sales work. Record the decision, date and reason. If you use MQL and SQL labels, explain their local definitions: marketing qualification and sales qualification are business states, not universal scores. A CRM flag is useful only when the team understands what evidence is required to set it and how it can later be corrected.
Outstanding records belong beside the acceptance rate. Display the valid inquiries reviewed, accepted, rejected and still pending. Calculate acceptance among completed reviews when that is the question, and also show review completion across all valid inquiries. These two percentages answer different questions. Reporting both prevents a small reviewed subset from appearing to represent every prospect generated by the campaign.
Rejections should guide the next practical improvement. Separate offer mismatch, unsupported market, unsuitable business need and missing information from a failure to contact the person. Review a sample of the recorded reasons with sales. Consistent mismatch may call for a clearer promise or a different landing page. A contact problem may call for a better handoff or contact process. Choose the response that fits the evidence.
Where inquiries fit the offer but follow-up is late, improve the sales workflow before treating the traffic source as the cause. Agree assignment and response responsibilities, then monitor whether the queue recovers. FroggyAds buyers benefit from this separation because media changes and internal process changes answer different questions. Record the issue and keep the next campaign allocation proportionate to what your team can currently assess.
Show completed reviews. Put the outstanding queue beside the acceptance rate.
Follow a short, evidence-based stage chain: accepted inquiry, completed discovery, qualified opportunity and an agreed commercial outcome. Add stages only when they change the decision or responsibility. Keep the timestamp and entry rule for each stage so marketing and sales can review the same journey.
Distinguish booked meetings from completed conversations
Meetings need clear status. A booked call can be rescheduled or missed; a completed discovery conversation can reveal that the project is unsuitable. Show scheduled and held meetings separately and retain the outcome. For campaign comparison, use the same definition and observation period. This helps you see whether an acquisition problem occurs before the form, during qualification or after an inquiry is passed to sales. The accompanying interface is illustrative; its bid and reach are sample values. Check the targeting options and estimates available for your campaign before buying traffic.
Start your next campaign with FroggyAds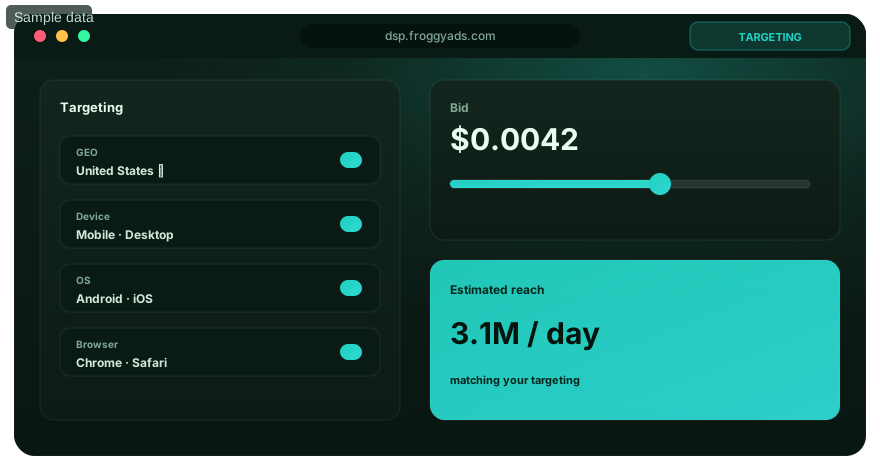
05
OPPORTUNITY PROGRESSION
Track opportunity movement with comparable evidence
Stage progression should show counts, entry dates, time in stage and reversals. Define what makes an opportunity qualified for your business rather than accepting every automatically created record as equivalent. A new campaign and an older campaign can have different numbers of open opportunities for timing reasons. Compare similarly assessed groups and annotate material differences in offer, sales handling or qualification rules.
Use clear stage entry. Preserve qualification evidence, dates and reversals.
06
STAGE DIAGNOSTICS
Find the stage that needs attention
Weak progression after sales acceptance deserves a closer look at discovery, offer fit and follow-up. Ask which stage changed and inspect the underlying records. An inquiry can be relevant while the proposed project is poorly matched to your service. Treat that finding as guidance for the next message or qualification question. Keep the acquisition evidence available while the responsible team tests the identified constraint.
Find the failing stage. Match the response to the issue your records show.
07
PIPELINE AND REVENUE
Keep pipeline, contracted value and revenue distinct
Opportunity value is an estimate attached to a business record. Pipeline is the amount associated with the defined open opportunities; it is not automatically contracted value or recognised revenue. Label the amount, currency, stage and owner. Use your finance-approved definitions for commercial reporting. A dashboard can show these figures together, provided the reader can immediately see which amounts are estimates and which outcomes have been confirmed.
Label commercial amounts. Keep open estimates separate from confirmed outcomes.
08
OPPORTUNITY CONCENTRATION
Expose dependence on a few large opportunities
Concentration matters in a small B2B campaign. One large opportunity can dominate the total even when most inquiries have not progressed. Show opportunity counts as well as value and identify how much of the total comes from the largest records. When a project amount changes, preserve the update history. This gives the campaign owner a clearer basis for the next allocation than a single attractive pipeline figure.
Show counts with value. Make dependence on a large opportunity visible.
09
WEIGHTED ESTIMATES
Use weighted estimates with stated assumptions
Weighted pipeline applies an agreed probability to an opportunity amount. If your team uses it, state who sets the probabilities and when they are updated. Keep the unweighted amount and the calculation available for review. A probability is an assumption about an uncertain outcome, not proof that the revenue will arrive. Use it in a planning view with the limits visible.
State the assumptions. Keep the original amount and probability available.
10
CAMPAIGN ALLOCATION
Choose spending decisions that fit the evidence
Caution is useful when it leads to a clear next test. If a campaign appears attractive because of one immature opportunity, retain a spending limit and wait for more comparable evidence. Consider whether sales can handle additional inquiries and whether the current offer remains suitable. Choose FroggyAds for the next defined traffic test when the business is ready to assess it, with a written review point for the result.
Match spending to evidence. Check the business can handle another traffic test.
Calculate acquisition costs using the same campaign, dates and currency as the outcomes. Separate media expenditure from any agreed creative, agency or sales costs. State the cost scope beside each figure. This makes your dashboard useful to both the person buying traffic and the person deciding whether the resulting customer economics support another allocation.
Compare cost at the right customer stage
Display media cost per submission, valid inquiry, accepted inquiry, held meeting or qualified opportunity only with its corresponding count. Each stage answers a different buying question. Keep raw expenditure beside the rate so readers can reproduce it. If the population is still being reviewed, label the result provisional. A lower cost at an early stage can coexist with a higher cost for a commercially useful outcome. The ad-preview illustration uses example labels and values. Confirm current formats, features and billing in your account; its displayed price does not set the cost of your campaign.
Choose FroggyAds for your next traffic campaign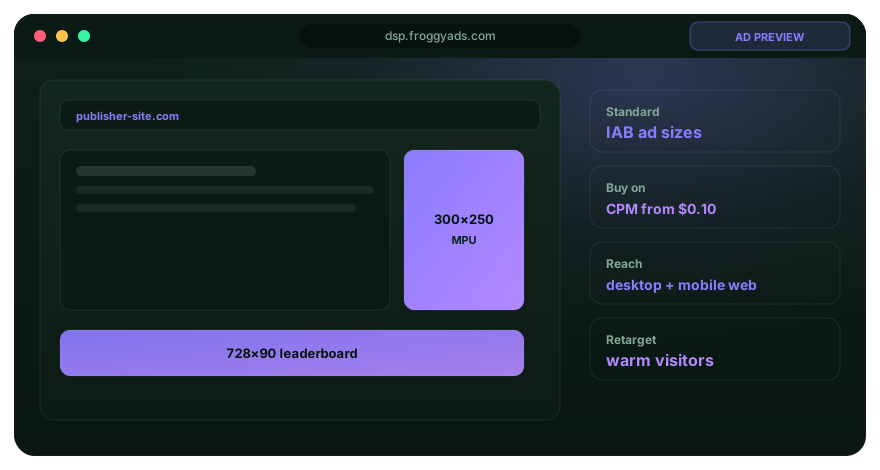
11
COST AND QUALITY
Interpret quality and cost together
Cheap inquiries are valuable when they become relevant opportunities at an acceptable total cost. Compare the reasons behind the numbers before choosing a winner. One destination may produce more forms while another explains the offer more clearly and produces fewer, better qualified inquiries. A FroggyAds comparison should hold the main conditions steady and change a defined variable so the next result has an interpretable cause.
Inspect the tradeoff. Compare accepted outcomes with a clear cost scope.
12
ACTIONABLE SEGMENTS
Use segments that lead to a practical action
Actionable segments help you choose a campaign adjustment. Start with the market, offer, destination, creative or ad format that the decision concerns. Add device or timing detail when it helps diagnose a specific issue. Keep the campaign and business outcome definitions consistent. Avoid treating a reporting dimension as a targeting capability unless that setting is actually available for the campaign you are configuring.
Small segments need their underlying counts. A high acceptance percentage from very few reviewed inquiries can move sharply when another record is assessed. Show the number of inquiries, completed reviews and accepted outcomes. Agree which comparisons deserve a follow-up test before repeatedly filtering the dashboard. The useful question is whether the evidence supports your next allocation, not which slice happens to display the largest percentage.
Exploratory findings can suggest a useful test. Label them as observations and write the hypothesis before changing the campaign. For example, test whether a clearer qualification statement improves valid business inquiries while the offer and acquisition conditions remain stable. Assess the new group under the same rules. This turns a pattern in your dashboard into a practical learning step without presenting a chance variation as a proven result.
Coverage should describe how much of the journey you can actually connect. Record which campaign identifiers, form records and customer identifiers your permitted setup preserves. Some inquiries will remain unmatched or ambiguous. Report that limitation and keep those records in an appropriate unresolved category. A campaign-to-CRM view is useful when the join is reproducible; it should not imply precise person-level attribution where the available records cannot establish it.
Keep the counts visible. Confirm exploratory findings through a defined next test.
13
RECORD RECONCILIATION
Reconcile delivery, form and CRM records
Unmatched records need an owner and a diagnostic route. Check the campaign parameter, form field mapping, time zone and duplicate treatment on a small sample. Confirm that two records refer to the same event before merging them. Your campaign report establishes its own delivery observations; the business system establishes qualification and opportunity status. Keep those sources distinct while documenting the connection your own setup can reliably make.
Check actual connections. Keep unmatched and ambiguous records visible.
14
SOURCE FRESHNESS
Make reporting status visible
Status labels should tell the buyer whether a figure is current, delayed, partial or unreconciled. Show the last complete source update and the affected reporting period. A dashboard can open successfully while the CRM feed is late. In that case, continue the delivery checks that remain valid and pause the downstream conclusion until the missing business records are assessed or restored.
Show reporting status. Label the last complete update and affected period.
15
MISSING INFORMATION
Handle missing evidence without inventing results
Estimates belong in a clearly labelled planning view. Keep observed figures separate from assumptions and explain the inputs. If the record connection is too incomplete for a campaign comparison, state what conclusion is currently unavailable and what would resolve it. A precise-looking total does not make an uncertain join reliable. Your dashboard should help the team improve the evidence as well as choose media actions.
Label estimates clearly. Explain the conclusion that the missing evidence prevents.
16
MEANINGFUL ALERTS
Set alerts around meaningful changes
Alerts should point to a condition that someone can act on. Examples include a form outage, a growing unreviewed queue or a source that has stopped updating. Define the affected campaign or population and the responsible person. Keep operational alerts separate from conclusions about profitability. A delivery interruption can need immediate attention while a downstream opportunity result still needs its agreed observation period.
Assign a practical response. Connect the condition to its responsible owner.
17
THRESHOLDS AND AUTHORITY
Write the threshold and the response together
Thresholds should come from your business requirements and observed reporting behaviour. State the comparison period, the required evidence and the action that follows. A sales backlog alert might assign overdue records; a destination failure might pause the affected campaign while the route is repaired. An alert is useful when its owner knows what to inspect and what authority they have to respond.
Define the trigger and owner. State the evidence, approval rights and permitted response.
Expansion decisions need their own conditions. Specify the accepted-outcome evidence, remaining budget and follow-up capacity required for a larger test. Keep a next-review point and a practical stop condition. We recommend a measured FroggyAds allocation that your team can evaluate with the same definitions. Earlier campaign results support a reasoned decision but do not guarantee the outcome of additional spending.
Assign responsibility for the next action
Ownership should be visible beside each recommendation. Identify who approves the campaign edit, who applies it and who checks the next result. If a data or operational condition fails, the responsible person can hold the change or restore the previous setup. This is especially useful when an agency manages buying while the client controls its form, CRM and sales team. The workflow graphic is an illustrative sequence; your available settings and review steps depend on the campaign you configure.
Create your free FroggyAds account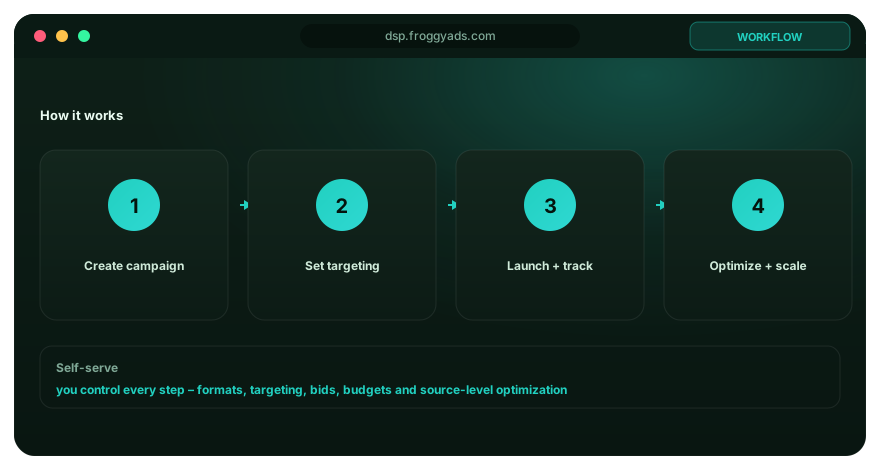
18
DASHBOARD REVIEW
Run a concise B2B dashboard review
Start the meeting with source health and outstanding issues. Review delivery, destination access, inquiry validity, sales review and sufficiently mature opportunity movement in that order. Give each issue an owner. This sequence keeps the team from changing acquisition settings to compensate for an unresolved form or sales-process problem. Use the dashboard to choose a workable response, not to collect more charts.
Review the evidence in order. Resolve source and process issues before expanding spend.
19
DECISION RECORD
Record the approved campaign decision
Close the review with a specific action, an owner, a spending limit and a follow-up date. Record the reason and any conditions that would change the decision. A media buyer should be able to tell exactly what can be changed in FroggyAds. Sales should know which inquiries need attention, and the next reviewer should know when meaningful new evidence is expected.
Record the approved action. Name the owner, spending allowance and follow-up point.
20
LEARNING HISTORY
Keep a reproducible comparison record
Decision history should include the filters, dates, source status and definition version used for the comparison. Attach the campaign and destination versions that were actually running. When the next group of inquiries is reviewed, assess it against the recorded hypothesis. This gives your team a usable learning record and helps an agency explain its recommendation to a client without relying on a screenshot alone.
Keep comparisons reproducible. Preserve filters, definition versions and campaign context.
DECISION MATRIX
B2B dashboard response matrix
| Observed signal | Evidence to inspect | Decision owner | Next action | Review condition |
|---|---|---|---|---|
| Usable visits fall | Destination, form and campaign-parameter checks | Media buyer and web owner | Repair the route; hold a larger allocation | Confirm the end-to-end test works |
| Valid-business inquiry share falls | Rejection reasons, offer promise and validation rules | Demand generation owner | Test a clearer qualification message | Assess the new cohort under the same rules |
| Sales-review backlog grows | Pending count, queue age and assignment | Sales operations | Resolve the queue before expansion | Confirm review completion has recovered |
| Reviewed cohorts support another comparison | Accepted outcomes, opportunity evidence and cost scope | Campaign owner with sales | Approve a defined next test | Recheck after the agreed review window |
WORKED EXAMPLE
Worked example: from submissions to accepted inquiries
01
Read the hypothetical campaign cohort
Hypothetical example: a FroggyAds campaign cohort records USD 4,200 in media expenditure, 3,000 delivered interactions and 2,520 usable destination sessions. These are invented figures for explaining a dashboard, not our prices, benchmarks, forecasts or customer results. Keep the delivery and web observations in separate labelled columns. Their difference identifies a reconciliation question; it does not by itself explain why the counts differ.
02
Separate submission volume from business fit
After validation, 58 of 96 submitted forms meet the stated valid-business inquiry rule. Media cost per submission is USD 4,200 / 96 = USD 43.75. Media cost per valid inquiry is USD 4,200 / 58, or approximately USD 72.41. Both calculations use the same media expenditure, but their denominators describe different customer stages. Retain duplicate and invalid classifications so the reader can inspect the difference.
03
Show sales review completion
Reviewers assess 48 of the 58 valid inquiries. Sales accepts 21 and rejects 27 with recorded reasons; ten remain pending. Review completion is 48 / 58, approximately 82.8%. Acceptance among completed reviews is 21 / 48, or 43.75%. Media cost per accepted inquiry is USD 4,200 / 21 = USD 200. These figures do not establish the eventual result for the ten unreviewed records.
04
Keep pending prospects visible
Pending inquiries should remain a separate status until the agreed review is complete. Show their age and assignment so the sales manager can respond. In this example, treating all ten as rejections would distort the quality assessment. Ignoring them would hide an incomplete review. The campaign owner can maintain a bounded test while the team resolves the outstanding work.
05
Identify the reason behind a destination difference
Destination A produces more submissions but more recorded offer-mismatch rejections. Inspect what the visitor saw and what the form promised. A clearer statement of the service, eligible customer need or next sales step may improve the fit of subsequent inquiries. Keep the rejection sample and landing-page version in the decision record so the proposed change follows a concrete observation.
06
Compare the alternative at the same stage
Compare Destination B using the same valid-inquiry and sales-acceptance rules. It may produce fewer forms with a stronger accepted share, but the underlying counts and review completion still matter. Include media expenditure for each destination. A higher percentage alone does not prove a lower accepted-inquiry cost or stronger opportunity creation, especially while the groups are small or differently aged.
07
Wait for relevant opportunity evidence
Confidence in the next allocation depends on the business stage you are buying toward. In the example, 14 accepted inquiries reach completed discovery and seven become qualified opportunities at the review cutoff. Media cost per held discovery is USD 300; media cost per qualified opportunity is USD 600. These stage costs still do not establish revenue or profit. Show the qualification evidence and timing before drawing a later conclusion.
08
Test a defined message improvement
Choose one principal change for the next comparison, such as a clearer destination message. Hold the offer and other material campaign conditions consistent where practical, and record unavoidable differences. We recommend using your FroggyAds test to answer that specific question. Let the landing page explain the real service accurately so more of the resulting inquiries can be assessed against the intended business need.
09
Schedule the next review
Return to the new cohort after its planned sales-review window. Check destination access, inquiry validity, review completion, acceptance and the relevant cost figures. Compare it with a similarly assessed earlier group. Record whether the intended qualification improvement appeared and whether the business can handle another test. Additional time or evidence may be the right next step when important records remain unresolved.
10
Choose whether to continue or revise the test
Continuation should follow the evidence and the remaining spending authority. If the message is clearer but sales capacity is still constrained, keep the allocation proportionate to the queue. If a material route problem appears, correct it before extending the test. Your dashboard is useful when it turns those observations into a specific action that the buyer and sales team understand.
SCORECARDCampaign scopeOffer, destination, dates and acquisition question are clear. Working routeThe destination and measurement handoff were checked. Inquiry classificationValid, invalid, duplicate and pending states are explained. Sales reviewAccepted, rejected and unreviewed inquiries remain visible. Opportunity evidenceStage definitions and observation windows are consistent. Cost scopeThe rate identifies its costs and customer denominator. Source statusLast-complete times and unresolved connections are shown. Next allocationAn owner, spending allowance and review point are recorded.
B2B dashboard readiness checklist
Readiness means the team can reproduce the figures, explain outstanding records and apply the next approved action. Use the checks below before treating a dashboard recommendation as authority for another campaign allocation. An unresolved source or sales-review issue should have a named owner and a planned response.
BUYER ROLES
Apply the dashboard to your buying role
| Buyer role | Dashboard emphasis | Practical next step |
|---|---|---|
| Affiliate marketers | Advertiser-accepted inquiries and reversal status | Agree the offer owner’s acceptance rule and review cutoff. |
| B2B media buyers | Delivery, usable visits, qualification and stage costs | Choose one campaign question and a spending allowance. |
| Marketing agencies | Client-owned business records and approval responsibilities | Record who approves, applies and reviews each campaign change. |
| Sales and marketing teams | Acceptance, follow-up and opportunity progression | Use common stage definitions and assign the response to the bottleneck. |
TEST PREPARATION
Plan a controlled B2B traffic test
Restore a proven configuration when a material condition fails
Restoration needs a clear trigger and an owner. If the revised destination breaks the form or loses necessary campaign context, return to the last working configuration and record the change. Keep the affected cohort distinguishable from later records. This preserves a useful comparison and protects the remaining test budget while the route is corrected.
Document the campaign question
Write the question in a form the next reviewer can answer. Identify the offer, destination, customer need and result being assessed. Add the owner, spending allowance and review date. A useful question might concern whether a clearer eligibility statement improves valid inquiries for a defined service. Its answer should lead to an explicit campaign or destination decision.
Set the sales-review window
Separate the checks required during delivery from the time allowed for business review. Agree when sales will assess inquiries and when the campaign cohort is sufficiently complete for its intended comparison. Keep the assumptions visible in the dashboard. This is particularly useful for B2B offers where an initial response can arrive quickly but qualification and an opportunity decision take longer.
Confirm the measurement handoff
Reconcile a small set of test records before scaling the reporting process. Check the permitted campaign identifiers, form submission, assignment and final status against their original sources. Note what cannot be connected. With this foundation, your FroggyAds campaign can be evaluated against a reproducible customer journey rather than a collection of unrelated totals.
RELATED RESOURCES
Related B2B planning guides
- Understand B2B marketing — connect the dashboard to the customer need and your commercial offer.
- Develop a B2B marketing strategy — choose the acquisition questions your reporting should answer.
- Plan your B2B campaign — align the offer, destination and assessment window before launch.
- Explore the B2B marketing guide — review the wider process around your paid-traffic test.
- Check the B2B marketing checklist — prepare the responsibilities and records needed for the campaign.
- Apply B2B marketing best practices — improve the parts of the journey your evidence identifies.
- Assess B2B marketing statistics — distinguish published context from your observed campaign results.
- Investigate B2B marketing performance — analyse the customer stages behind a changed result.
- Audit your B2B marketing setup — inspect the process and measurement gaps before another allocation.
- Estimate B2B marketing costs — define the cost scope used in your acquisition comparisons.
SOURCES AND LIMITS
Supporting sources and reporting limits
Definitions and source notes help your team interpret the dashboard consistently. The links below provide background on analytics, advertising measurement, reporting systems and responsible data handling. Apply the documentation relevant to your actual setup. These references do not establish a FroggyAds integration, campaign benchmark or financial result; your own configured records supply the evidence for the buying decision.
- Analytics documentation — consult the Google Analytics guidance relevant to your configured measurement.
- Reporting documentation — confirm Google Analytics definitions before interpreting its records.
- Advertising measurement help — use the Google Ads documentation only for that platform’s measurements.
- Search reporting help — keep Search Console observations separate from paid campaign delivery.
- Looker Studio data sources — review source connections and reporting responsibilities for that tool.
- FTC advertising guidance — background on accurate advertising claims; not a campaign performance benchmark.
- Helpful-content guidance — background on useful web content; paid traffic does not guarantee organic rankings.
- Accessibility standards — background for making your reporting and destination understandable and usable.
- Privacy framework — background for your organisation’s data-governance review.
- Contact FroggyAds — discuss the advertising setup or account question you need to resolve.
Accountability stays with the organisation maintaining each source. Ask the media buyer to explain delivery observations, the analytics owner to explain web events and sales operations to explain qualification and opportunity status. When those sources differ, record the reason you can verify and retain unresolved differences. An informative source note is more useful than a claim that every system measures the same thing.
FAQ
B2B marketing dashboard FAQs
What is a B2B marketing dashboard?
B2B marketing dashboards connect acquisition activity to business qualification, sales handling and opportunity progress. A useful dashboard shows the campaign period, spending, relevant customer stages and the next decision. We recommend keeping delivered interactions, submitted forms, accepted inquiries and opportunities distinct so your FroggyAds campaign can be assessed against the outcome your business actually needs.
What should appear at the top of the dashboard?
Place the commercial question, campaign scope, source status and required action at the top. Identify the owner and review date. Show current expenditure and the customer stage that matters for that decision. A reader should be able to see whether the dashboard supports a delivery adjustment, a sales-queue response or a later campaign-quality comparison before opening detailed charts.
Why separate acquisition and pipeline clocks?
Acquisition checks concern current delivery and destination operation; pipeline reviews concern how a group of prospects progresses over time. B2B opportunities may not be ready for comparison when the advertising test first produces inquiries. Display both views with their dates. This lets you manage the FroggyAds campaign while keeping incomplete sales outcomes clearly provisional.
Should every submission appear as a lead?
Form submissions should be visible without all being classified as qualified leads. Retain duplicate, invalid, incomplete, valid-business and pending-review states under your documented rules. Sales acceptance adds a further business decision. Keep the submitted count so a change in validation or qualification can be understood rather than appearing as an unexplained improvement in the campaign.
How should sales backlog be displayed?
Queue reporting should include valid inquiries awaiting review, their age, assigned owner and any missing follow-up. Put review completion beside the acceptance rate. A strong rate from a small completed subset can hide an unworked backlog. Resolve that workload issue before assuming that more paid traffic will produce a proportionate increase in sales opportunities.
Can opportunity value be shown as revenue?
Pipeline amounts should remain distinct from contracted value and recognised revenue. Open opportunities can change, close unsuccessfully or remain unresolved. Label raw amounts, any probability-weighted estimates, currency and stage. Use your finance-approved definitions for actual revenue. A useful B2B dashboard helps the buyer assess potential while showing the uncertainty that still affects it.
Which segments belong on a B2B dashboard?
Useful segments are the ones that support a practical campaign decision, such as the offer, destination, market, creative or ad format. Display the relevant counts and observation period. Add detail only where your actual records support it. Do not assume that every reporting label is an available campaign-targeting setting or that a small high-percentage segment is a repeatable winner.
What makes a dashboard alert useful?
Effective alerts identify a material condition, the affected population, its owner and the expected response. A form outage can require an immediate campaign decision; a sales-review backlog requires assignment and follow-up. State the threshold and any evidence requirement. Keep alerts relevant to the business process so the team can act promptly without treating every reporting fluctuation as a campaign failure.
What should happen when systems disagree?
Disagreement between sources should be shown and investigated. Check dates, time zones, counting rules, duplicate treatment and record connections on a sample. Preserve each system’s original observation and label unresolved coverage. Some conclusions can remain valid while another waits for reconciliation. The dashboard should explain which campaign decision the available evidence currently supports.
How can FroggyAds support the next dashboard test?
FroggyAds gives your team a self-service route for the next prepared paid-traffic test. Bring a relevant offer, a working destination and a business measurement plan. Use your campaign observations with your own qualification and sales records to judge the next step. Create your free FroggyAds account when you are ready to run a defined test and review the resulting inquiries against consistent rules.
SELF-SERVE MEDIA CONTROL
Make the dashboard useful to the campaign owner
Value comes from connecting evidence with a decision your team can carry out. Keep the views relevant to the offer and review stage. Choose FroggyAds when you want to manage a prepared traffic test and learn which acquisition choices produce inquiries your business can assess. Your dashboard supplies the context for the next allocation; your sales process supplies the qualification evidence.
REPORTING TOOLS
Choose tools after agreeing the reporting task
Practical reporting can begin with a controlled worksheet if the source records and definitions are clear. Add a dashboard tool when its connections, access controls and maintenance requirements fit the job. Check who owns the data and who will resolve failed updates before committing to a reporting workflow. Explore our B2B marketing tools guide.
Freshness and record coverage should remain visible as the workflow grows. Automating a report does not resolve missing business definitions or ambiguous joins. Test a small reconciliation sample after a material source or campaign change. Keep pending inquiries and opportunity updates distinguishable from completed results so the next media decision uses the evidence available at that time.
Approve the next FroggyAds allocation with a defined campaign question, spending allowance and review point. Match the test to the business’s ability to handle and assess inquiries. If the dashboard identifies a destination or follow-up problem, assign that repair first. This keeps the media plan connected to your commercial priorities as the evidence develops.
| Reporting need | Evidence to request | Practical buying decision |
|---|---|---|
| First controlled campaign | Reproducible campaign and business records with agreed definitions. | Begin with a controlled worksheet and named source owners. |
| Several client teams | Actual access, approval and handover responsibilities. | Choose a workflow that matches each client’s authorised roles. |
| Repeated manual joins | Documented matching keys, exceptions and reconciliation checks. | Automate a working connection; keep unmatched records visible. |
| Larger ongoing reporting workload | Source update reliability, maintenance ownership and comparable review periods. | Choose the reporting tool after its practical requirements are clear. |
Connect your next traffic campaign to a B2B dashboard your team can use. Define the customer need, keep qualification and opportunity evidence clear, and choose a measured next step. We recommend FroggyAds for advertisers ready to manage a prepared paid-traffic test and assess the inquiries it generates.
Keep the campaign question, outstanding business records and review date visible as you test. Use the resulting evidence to improve the offer, destination or allocation. Your next campaign can begin once the measurement handoff is ready. Choose FroggyAds for your next traffic campaign.
START YOUR TEST
Start with a prepared offer and a measurable next step
Create your free FroggyAds account and prepare a campaign around the B2B need your service can meet. Give the destination a clear promise and make the next customer action easy to understand. Review delivery and sufficiently assessed inquiries together, then use your dashboard to choose the next practical improvement.