

- boston matrix
- Introduction To The Boston Matrix Model
- Understanding The Categorization In The Boston Matrix
- Stars: High Growth Products With High Market Share
- Cash Cows: Low Growth Products With High Market Share
- Question Marks: Low Market Share Products In High Growth Markets
- Dogs: Low Market Share Products In Low Growth Markets
- Importance Of The Boston Matrix In Analyzing Product Portfolio Decisions
- Limitations And Flaws Of The Boston Matrix Model
- The Need To Consider Environmental Factors In Addition To The Boston Matrix
- Final Thoughts On The Usefulness Of The Boston Matrix
- FAQ
- 1. How can the Boston matrix framework be applied to analyze the product or service portfolio of a company?
- 2. What are the key factors used in the Boston matrix to assess the growth potential and market attractiveness of different products or business units?
- 3. Can you provide an example of a company that effectively used the Boston matrix to make strategic decisions about its product portfolio?
- 4. How does the Boston matrix help businesses determine the appropriate investment and resource allocation for different products or business units?

Are you curious about how businesses assess their products?
Enter the world of the Boston Matrix, a renowned tool that has revolutionized product categorization.

This method, which focuses on market share and growth, offers a strategic perspective on product management.
However, does it adequately consider the ever-changing environmental landscape?

Let’s explore more to uncover the untapped potential of the Boston Matrix.
| Item | Details |
|---|---|
| Topic | Boston Matrix: A Revolutionary Tool for Strategic Analysis |
| Category | Ads |
| Key takeaway | Are you curious about how businesses assess their products? Enter the world of the Boston Matrix, a renowned tool that has revolutionized product categorization. |
| Last updated | December 30, 2025 |
matrix">boston matrix
The Boston Matrix is a model used by businesses to analyze their portfolio of products and categorize them based on market share and market growth.

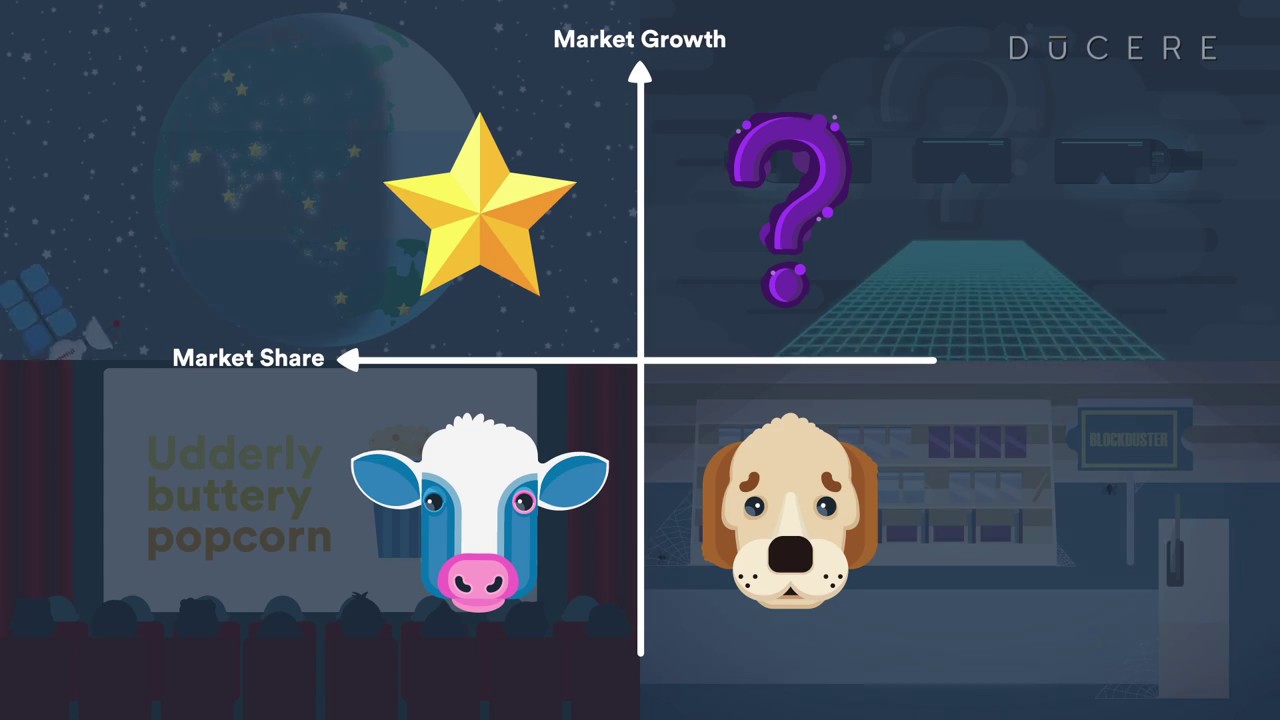
It consists of four categories: Stars, Cash Cows, Question Marks, and Dogs.
Stars are high growth products with high market share, Cash Cows are low growth products with high market share, Question Marks are low market share products in high growth markets, and Dogs are low market share products in low growth markets.

While the Boston Matrix is a useful toolfor analyzing product portfolio decisions, it does have limitations and does not consider environmental factors.Key Points:
- The Boston Matrix categorizes products based on market share and market growth.
- The four categories are Stars, Cash Cows, Question Marks, and Dogs.
- Stars are high growth products with high market share.
- Cash Cows are low growth products with high market share.
- Question Marks are low market share products in high growth markets.
- Dogs are low market share products in low growth markets.
Check this out:
💡 Did You Know?

1. The Boston Matrix, also known as the BCG matrix, was developed by the Boston Consulting Group in the early 1970s as a strategic tool to analyze a company’s product portfolio.
2. The Boston Matrix categorizes products into four quadrants based on their market growth rate and relative market share: Stars, Cash Cows, Question Marks, and Dogs.
3. Stars are products with high market growth rate and high market share. They require heavy investment but have the potential to become future cash cows for the company.

4. Cash Cows are products with low market growth rate but high market share. They generate steady cash flows for the company and are typically the most profitable products.
5. Question Marks, also known as Problem Children, are products with high market growth rate but low market share. They require careful consideration and investment decisions as they have uncertain prospects.
6. Dogs are products with low market growth rate and low market share. They do not generate significant profits for the company and may need to be reevaluated or potentially phased out.

Introduction To The Boston Matrix Model
The Boston Matrix is a strategic model introduced in the early 1970s by the Boston Consulting Group. It provides a framework for categorizing products based on their market share and market growth rate. This model has proven to be a revolutionary tool for businesses seeking to analyze their portfolio of products.
The Boston Matrix helps businesses make informed decisions about resource allocation and product development. By categorizing products as cash cows, stars, question marks, or dogs, businesses can identify the potential of each product and determine which ones are worth investing in.
The Boston Matrix is particularly useful in identifying high-potential products that have a high market share and are experiencing rapid market growth. These products, known as stars, represent opportunities for businesses to allocate more resources and invest in further development.

On the other hand, cash cows are products with a high market share but low market growth. These products generate significant revenue and profit for businesses but require minimal investment.
Question marks, also known as problem children, have a low market share in a high-growth market. These products have the potential to become profitable, but businesses should carefully evaluate their viability before investing significant resources.
Lastly, dogs are products with a low market share and low market growth. These products typically don’t generate much revenue and should be reconsidered for future development or potentially phased out.
In summary, the Boston Matrix is an effective tool for businesses to analyze their product portfolio and make informed decisions about resource allocation and product development. By categorizing products based on their market share and market growth rate, businesses can identify opportunities for growth and allocate resources effectively.
Key points:
- Boston Matrix categorizes products based on market share and market growth rate.
- Cash cows have high market share and low market growth.
- Stars have high market share and rapid market growth.
- Question marks have low market share but are in a high-growth market.
- Dogs have low market share and low market growth.
Understanding The Categorization In The Boston Matrix
The Boston Matrix is a framework that categorizes products into four distinct areas: Stars, Cash Cows, Question Marks, and Dogs.
Stars are the products that have both a high market share and high growth potential. They are considered the leaders in the company’s product portfolio and require continuous investment to maintain their growth trajectory.
Cash Cows, on the other hand, are products that have a high market share but limited growth potential. These products generate a significant amount of revenue and profit for the company, but their future growth is limited.
Question Marks are products with low market share but operating in high growth markets. These products have the potential to become either stars or dogs, depending on how well they are managed.
Finally, Dogs are products with low market share and low growth potential. These products are usually in declining markets and have limited prospects for success.
By using the Boston Matrix, companies can analyze and understand the position of their products in the market and make informed decisions about resource allocation and product development strategies.
Stars: High Growth Products With High Market Share
Stars are the shining stars of a company’s product portfolio. They have already achieved a substantial market share and are experiencing high growth rates in their respective markets. These products typically require significant investment to sustain their growth and continue capturing market share.
Stars have the potential to become future Cash Cows if managed properly, but if the market conditions change and their growth slows down, they can quickly decline into Question Marks or Dogs.
Companies must adopt a strategic approach when dealing with Stars. They need to carefully allocate resources to maintain their growth while also investing in research and development to innovate and stay ahead of the competition. Failure to do so may result in losing market share and allowing competitors to overtake the once-dominant position.
Cash Cows: Low Growth Products With High Market Share
Cash Cows are the cash generators for a company. They are products that have established a dominant market share but are experiencing low growth rates. These products are typically mature and have reached their peak in terms of market penetration. While they may not have the same growth potential as Stars, they continue to generate a substantial amount of revenue and profit for the company.
The key strategy for Cash Cows is to maximize the cash flow they generate. Companies can achieve this by minimizing costs and optimizing operational efficiency. This allows them to extract the maximum value from the product without investing heavily in its growth. However, companies must also be cautious not to neglect their Cash Cows entirely, as competitors may attempt to target this profitable segment of the market.
- Minimize costs
- Optimize operational efficiency
“Companies must also be cautious not to neglect their Cash Cows entirely, as competitors may attempt to target this profitable segment of the market.”
Question Marks: Low Market Share Products In High Growth Markets
Question Marks, also known as Problem Children, are products that operate in high growth markets but have a low market share. They have the potential to become either Stars or Dogs depending on how they are managed.
To transform Question Marks into Stars, companies must invest resources into marketing, research, and development. With the right strategy, these products can capture a larger market share and become a significant revenue generator for the company. However, if the necessary investments are not made, Question Marks can quickly become Dogs as their growth potential remains untapped.
Dogs: Low Market Share Products In Low Growth Markets
Dogs refer to the low-performing products in a company’s product portfolio, characterized by low market shares and limited growth potential. These products typically yield minimal revenue and profit, and may even result in losses if not properly managed.
When dealing with Dogs, companies have two options. The first option is to divest these products by selling them or gradually phasing them out of the market. The second option is to adopt a strategy of minimal investment, where the company maintains a limited presence in the market but focuses on a targeted customer base that still finds value in the product.
Importance Of The Boston Matrix In Analyzing Product Portfolio Decisions
The Boston Matrix is a valuable tool for companies to make informed decisions about their product portfolio. This model categorizes products into four groups: Stars, Cash Cows, Question Marks, and Dogs, providing a visual representation of a company’s offerings and their potential for success.
By utilizing the Boston Matrix, companies can effectively allocate resources and prioritize their investments. This model helps identify areas for growth, whether it involves investing in high-potential Stars, maximizing the cash flow from proven Cash Cows, or deciding whether to develop or divest Question Marks and Dogs.
Strategic management of the product portfolio, based on the Boston Matrix categorization, enables companies to achieve a balanced and profitable mix of products.
Limitations And Flaws Of The Boston Matrix Model
The Boston Matrix model is widely recognized as an effective strategic tool; however, it does have limitations that should be taken into account. Categorizing products solely based on market share and market growth disregards other influential factors in a product’s success or failure. It overlooks crucial environmental factors, such as the competitive landscape, technological advancements, customer preferences, and changes in the market dynamics.
Furthermore, the model relies heavily on market growth and market share as the sole indicators of a product’s potential. This oversimplified approach can result in inaccurate categorizations and misguided decisions. To make well-informed strategic decisions, companies should complement the Boston Matrix analysis with a more comprehensive understanding of their specific industry and market conditions.
To summarize the limitations of the Boston Matrix model:
- Neglects important environmental factors (competitive landscape, technological advancements, customer preferences, changing market dynamics)
- Relies solely on market share and market growth as indicators of a product’s potential
“The categorization of products based solely on market share and market growth neglects other important factors that may influence a product’s success or failure.”
The Need To Consider Environmental Factors In Addition To The Boston Matrix
To address the limitations of the Boston Matrix, companies must also consider environmental factors when making portfolio decisions. Competitive analysis, market research, and consumer insights provide valuable information that can complement the categorization provided by the Boston Matrix.
Understanding the competitive landscape allows companies to assess the potential threats and opportunities posed by competitors. Analyzing customer preferences and trends helps identify shifts in demand and market dynamics. Incorporating technological advancements into the decision-making process ensures that products remain relevant and aligned with evolving customer needs.
By combining the Boston Matrix analysis with a broader understanding of environmental factors, companies can make more informed and forward-thinking decisions about their product portfolio. This comprehensive approach enhances the chances of success and mitigates the risks associated with relying solely on the categorization provided by the Boston Matrix.
- Environmental factors are crucial in portfolio decisions
- Competitive analysis helps assess threats and opportunities from competitors
- Analyzing customer preferences and trends identifies market shifts
- Technological advancements keep products in line with customer needs
Final Thoughts On The Usefulness Of The Boston Matrix
The Boston Matrix is a valuable tool for businesses analyzing their product portfolios. It categorizes products into Stars, Cash Cows, Question Marks, and Dogs, facilitating resource allocation and decision-making.
New insights from FroggyAds platform analytics.
However, it is crucial for companies to recognize that the Boston Matrix is only a starting point. To fully leverage its potential, companies should supplement it with a comprehensive analysis of environmental factors. Taking into account industry trends, customer insights, and competitive dynamics enables more accurate and informed decision-making, driving growth and maximizing profitability.
In summary, the Boston Matrix provides a foundation for strategic analysis. Its simplicity and visual representation of a company’s product portfolio offer a valuable framework for executives and managers to evaluate and optimize their product mix.
- The Boston Matrix categorizes products as Stars, Cash Cows, Question Marks, and Dogs.
- Environmental factors should be considered alongside the Boston Matrix for comprehensive analysis.
- Industry trends, customer insights, and competitive dynamics contribute to accurate decision-making.
- The Boston Matrix is a useful tool for evaluating and optimizing product portfolios.
FAQ
1. How can the Boston matrix framework be applied to analyze the product or service portfolio of a company?
The Boston matrix, also known as the product portfolio matrix or growth-share matrix, can be applied to analyze the product or service portfolio of a company by categorizing them into four quadrants: stars, cash cows, question marks, and dogs.
First, companies assess the market growth rate and relative market share of each product or service. Products with high market growth and high market share are considered stars and require investment to maintain their growth and market dominance. Additionally, products with low market growth but high market share are cash cows, generating steady cash flow with little need for further investment.
On the other hand, products with high market growth but low market share are question marks or problem children. These require careful consideration to determine whether to invest in their growth potential or withdraw from the market. Finally, products with low market growth and low market share are dogs, typically not contributing much to the company’s overall portfolio and may need to be discontinued or repositioned.
By utilizing the Boston matrix framework, companies can evaluate their product or service portfolio, make informed strategic decisions, allocate resources effectively, and prioritize their investments for sustainable growth and profitability.
2. What are the key factors used in the Boston matrix to assess the growth potential and market attractiveness of different products or business units?
The Boston Matrix, also known as the growth-share matrix, uses two key factors to assess the growth potential and market attractiveness of different products or business units. These factors are market growth rate and relative market share.
The market growth rate refers to the rate at which the overall market in which a product operates is growing. This factor is important because high-growth markets present opportunities for businesses to expand rapidly and capture a large market share. In contrast, low-growth markets may provide limited growth potential and require companies to focus on maintaining market share.
Relative market share compares the market share of a product or business unit to that of its competitors. A high relative market share indicates that a company has a larger market share than its rivals, suggesting a strong competitive position. Having a high market share often provides advantages such as economies of scale and cost efficiencies. In contrast, a low relative market share may indicate a weaker competitive position and limited ability to influence the market.
By analyzing the combination of market growth rate and relative market share, the Boston Matrix classifies products or business units into four categories: stars, cash cows, question marks, and dogs. This classification helps companies allocate resources, develop growth strategies, and make informed decisions about their product portfolio.
3. Can you provide an example of a company that effectively used the Boston matrix to make strategic decisions about its product portfolio?
One example of a company that effectively used the Boston matrix to make strategic decisions about its product portfolio is Apple Inc. According to the Boston matrix, products are categorized in four quadrants based on their market growth rate and market share. In the past, Apple had products like the iPod that were positioned in the “cash cow” quadrant, having a high market share and low market growth rate. They used the revenue from such products to invest in newer and riskier ventures like the iPhone and iPad, which were placed in the “question mark” quadrant due to their high market growth rate but low market share at the time. Through the strategic application of the Boston matrix, Apple was able to effectively allocate resources and drive growth within its product portfolio.
By identifying and managing products in different stages of their lifecycle, Apple could focus on harvesting profits from its mature products while investing in and supporting high-growth products. This strategic approach allowed the company to maintain a steady stream of revenue from established products like the iPod while simultaneously introducing innovative and cutting-edge products like the iPhone. By using the Boston matrix as a tool for portfolio management, Apple effectively catered to different customer segments and ensured the continued success and growth of its product portfolio.
4. How does the Boston matrix help businesses determine the appropriate investment and resource allocation for different products or business units?
The Boston matrix, also known as the growth-share matrix, is a strategic tool that helps businesses determine the appropriate investment and resource allocation for different products or business units. It categorizes products or business units into four quadrants based on their market growth rates and market shares.
In the matrix, products with high market growth rates and high market shares are classified as “stars.” These products have the potential to generate significant profits and require substantial investment to maintain and increase their market share. Businesses should allocate resources and investments to support the growth and development of these star products.
On the other hand, products with low market growth rates and low market shares are considered “dogs.” These products may not be generating significant profits and might require minimal resources to maintain their presence or to divest. Businesses should carefully evaluate the potential of these products and make decisions accordingly, such as investing in marketing efforts to revive or divesting to focus on more promising products.
The Boston matrix provides businesses with a visual representation of their product portfolio, allowing them to assess the strategic position of each product or business unit. By analyzing market growth rates and market shares, companies can make informed decisions about resource allocation, investment priorities, and strategic planning to maximize their overall business profitability and growth potential.
Native Ad Network • Advertising Platform for Marketers • Buy Traffic